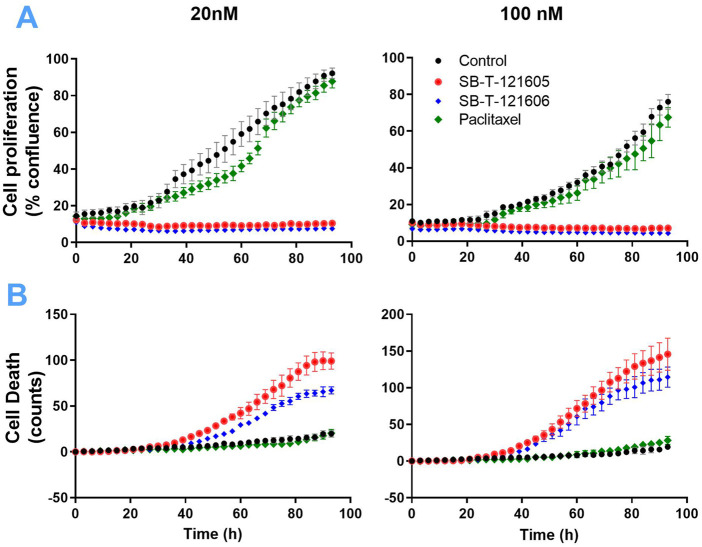
FIGURE 3.
Proliferation (A) and death (B) of NCI/ADR-RES cells measured by the real-time monitoring for 96 h without taxane treatment (black curves) and after the treatment with 20 nM and 100 nM PTX (green curves), SB-T-121605 (red curves), and SB-T-121606 (blue curves). Data are present as means ± SD of three independent measurements.

