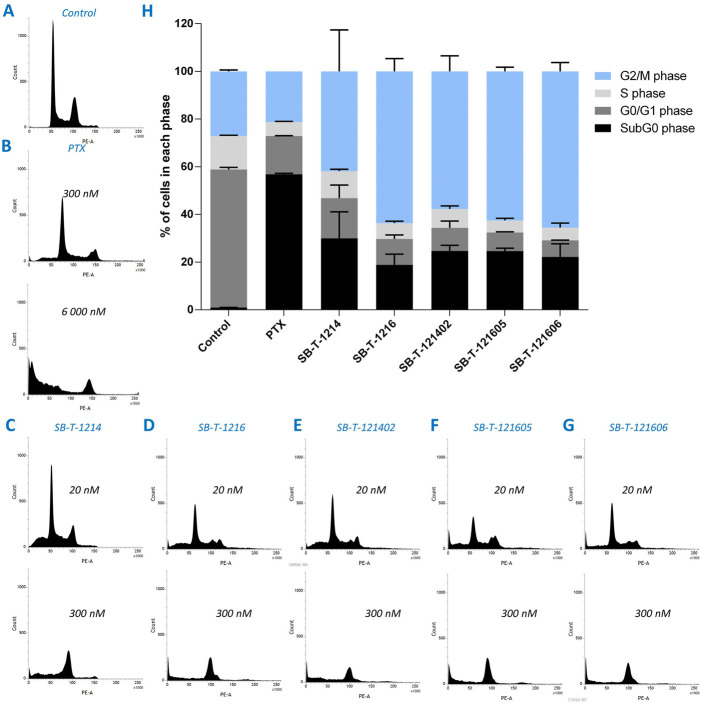
FIGURE 5.
Visualization of the distribution of cell cycle phases in NCI/ADR-RES cells incubated with pure medium (A), PTX (B), and different SB-Ts at 20 or 300 nM concentration (C–G). Cell cycle analysis (H) shows percentage of cells in different cell cycle phases for 6000 nM PTX and 300 nM SB-Ts. Error bars present standard deviation of two individual experiments.

