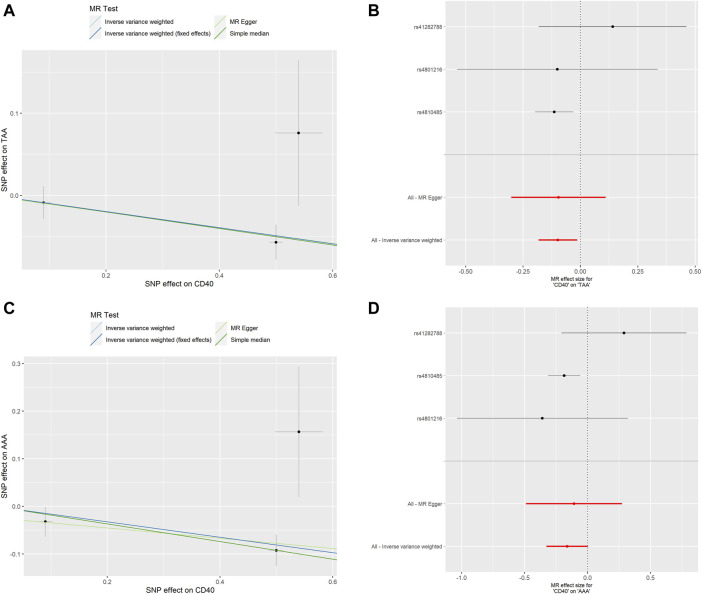
FIGURE 4.
MR analyses of genetic proxied CD40 levels on the risk of AA subtypes. The scatterplot (A) and the forest plot (B) of the MR analysis of CD40 and TAA. The scatterplot (C) and the forest plot (D) of the MR analysis of CD40 and AAA. AA, aortic aneurysm; TAA, thoracic aortic aneurysm; AAA, abdominal aortic aneurysm; MR, Mendelian randomization.

