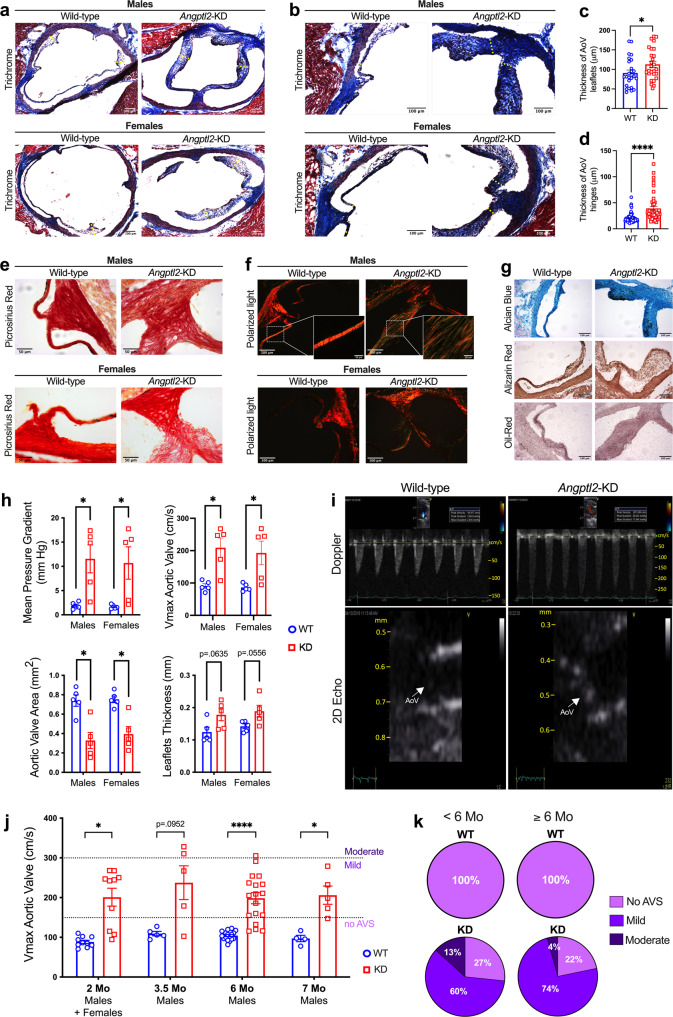
Fig. 4. Adult Angptl2-KD mice develop spontaneous AVS.
a, b Representative AoV sections (of n = 11–13 independent experiments per genotype) from 2-month old male and female WT and Angptl2-KD mice stained using Masson’s Trichrome. The yellow dotted lines show the regions used for the quantification. Quantification of valve thickness shows the enlargement of both (c) the leaflets and (d) the hinges of AoV in male and female Angptl2-KD mice compared to WT. Data are means ± SEM of n = 13 for WT mice, 7 males and 6 females; n = 11 for Angptl2-KD mice, 5 males and 6 females; up to 3 leaflets (n = 25 for WT and n = 27 for Angptl2-KD mice) and 6 hinges (n = 64 for WT and n = 51 for Angptl2-KD mice) were quantified per section. *: p < 0.05 determined with unpaired t-test. e Representative AoV sections (of n = 3 independent experiments) from 2-month old male and female WT and Angptl2-KD mice stained using Picrosirius red under white light and (f) Picrosirius red under polarized light. g Representative AoV sections (of n = 3 independent experiments) from 2-month old male WT and Angptl2-KD mice stained using alcian blue, alizarin red and oil-red. h Echocardiographic measurements of the mean pressure gradient, the peak aortic jet velocity (Vmax), the leaflets thickness and the AoV area in male (n = 5) and female (n = 5) WT and Angptl2-KD mice at 2 month-old (n = 10 mice per genotype). Data are means ± SEM of n mice. *: p < 0.05 determined with Mann–Whitney U test. i Pulsed-wave Doppler velocity tracings illustrating the increased cross AoV velocity in an Angptl2-KD male mouse compared to a WT littermate and 2D images of AoV (indicated by white arrows) in the long-axis view from WT and Angptl2-KD mice. j Echocardiographic measurements of the maximal trans-aortic velocity (Vmax) in Angptl2-KD mice compared to WT littermates from 2 months to 7 months. Data are means ± SEM of: n = 10 mice per genotype at 2 months; n = 5 mice per genotype at 3.5 months; n = 18 mice per genotype at 6 months; n = 4 WT mice and n = 5 Angptl2-KD mice at 7 months. *: p < 0.05 determined with unpaired t-test or Mann–Whitney U test according to the normality of distribution. k Pie charts illustrating the repartition of the phenotype severity for the AVS (defined according to Vmax: a Vmax ≥150 cm/s corresponds to a mild AVS, while a Vmax ≥300 cm/s corresponds to a moderate AVS) in young (<6-month-old) and older (≥6-month-old) WT and Angptl2-KD mice.

