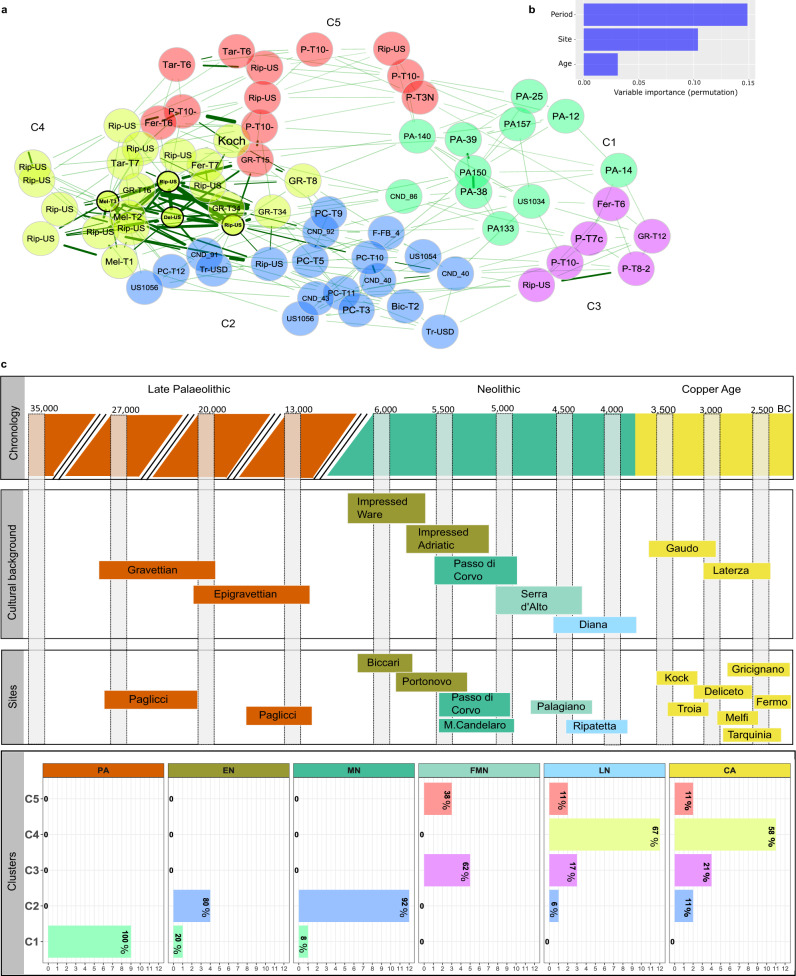
Fig. 2. Metagenomic analysis.
a Network analysis among samples. The edge thickness is based on their weights, which indicate non-negative similarities among samples, while edges length represent nodes distance based on Aitchison distance. Node colour is defined by the cluster identified by hierarchical cluster analysis, and the black border colouration around the node identifies the hubs. b Random forest classification analysis results, highlighting the importance of period and geography (site) as the main variables forming the basis of the cluster differences, while the age of death (Age) is not discerning. c Correspondence of the investigated time (i.e., chronology), with the cultural background (second block), the selected archaeological site (third block) and the results from the cluster analysis (C1-C5) reported in panel a. In the “Cultural background” block, each Neolithic culture is defined by a different colour, which highlights its association to the archaeological sites (third block) and to the specific Neolithic phase reported in the headings of the “Clusters” block (i.e., EN, MD, FMN, LN). In the last block (i.e., called “Clusters”), sample numbers are reported on the x-axis and cluster annotation on the y-axis. Each bars’ colour is associated to clusters ‘colours reported in panel a. Within each bar, the percentage of samples falling within a specific cluster is reported in bold. Here, following cluster rows, we can appreciate that PA samples fall together within the first cluster (C1), while EN and MN in the C2. LN and CA are particularly present in C4, while FMN is divided between C3 and C5. Source data are provided as Source data file.

