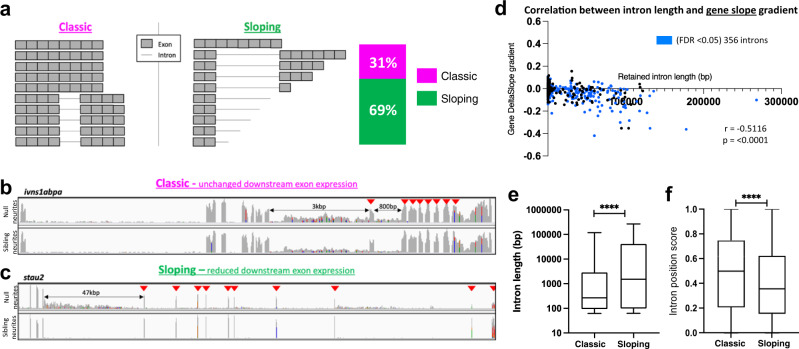
Fig. 3. Two types of intron-retaining transcripts become neurite localised in null neurons.
a Schematic representation of the two types of IR-transcripts enriched in null neurites. The stacked bar graph shows the proportion of genes expressing ‘classic’ full-length IR transcripts (magenta) and ‘sloping’ prematurely terminated IR transcripts (green) transcripts; n = 356 genes, FDR < 0.05. b, c Example gene plots for each of the two types of IR-transcript in null neurites. Arrows indicate exons downstream of the retained intron/s. b ivns1abpa, intron-8-retaining, and intron-9-retaining transcripts with no change in downstream exons expression. c stau2, intron-5-retaining transcripts showing reduced expression of downstream exons. d Correlation between retained intron length and 5’→3’ exonic read slope gradient. Gradients calculated for the 356 genes encoding IR-transcripts (blue datapoints, FDR < 0.05). Two-sided Pearson correlation coefficient, r: −5116, p < 0.0001. e Box and whiskers plot showing the difference in length of retained introns in each IR-transcript category. The box boundaries represent the upper and lower quartiles, and the middle line is the median. Whiskers show maximum and minimum values. Two-sided Wilcoxon-signed rank test, ****p < 0.0001. n = 570 introns from multiple intron-containing genes. f Box and whiskers plot showing the difference in position of the retained introns in transcripts for each IR-transcript category. The box boundaries represent the upper and lower quartiles, and the middle line is the median. The whiskers show the maximum and minimum values. Two-sided Wilcoxon-signed rank test, ****p < 0.0001. n = 570 introns from multiple intron-containing genes.

