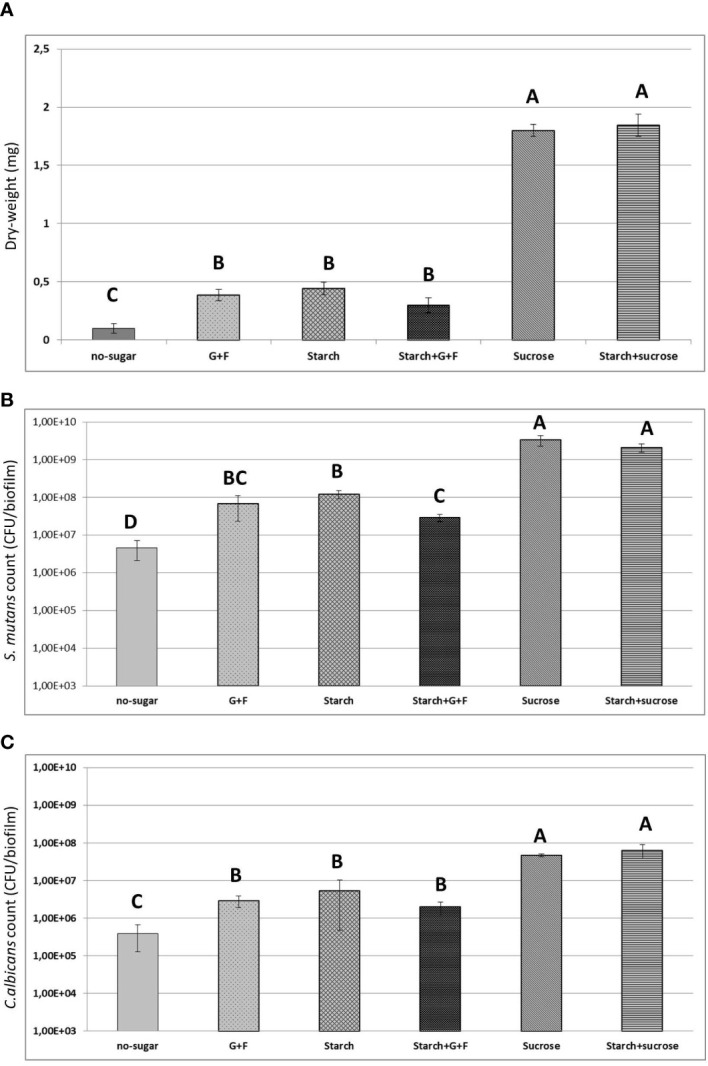
Figure 4.

Results of biochemical and microbiological assays. (A) Total biomass (measure as dry-weight in mg) of 19h biofilms originated from different sugar-mediated aggregates. (B) Counts of S. mutans (CFU) within the biofilms (C) Counts of C. albicans (CFU) within the biofilms. Bars denote the mean and vertical lines denote standard deviation. G+F: glucose+fructose. Groups with distinct capital letter are statistically different (p<0.05 by one-way ANOVA with Tukey test)" by: Groups whose means are followed by different upper case letters differ statistically by ANOVA followed by Tukey test (p<0.05).
