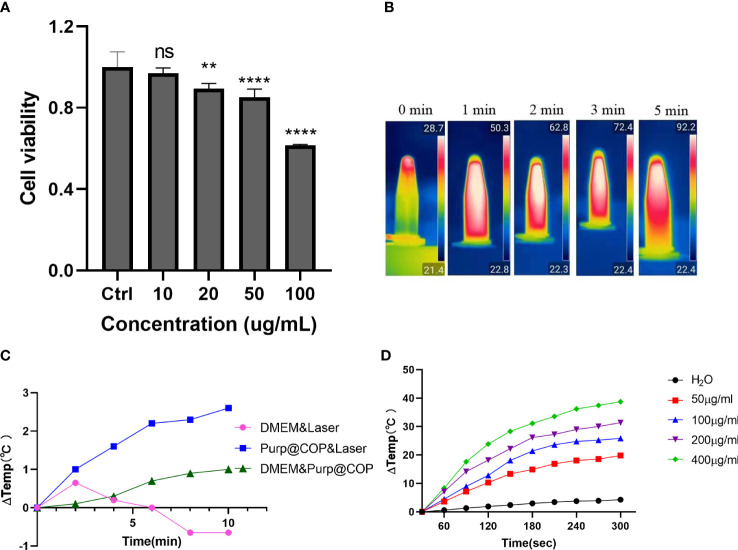
Figure 3.
Heating effect results of Purp@COP. (A) Cell activity results of HepG2 cells after culture for 24 h with 10, 20, 50, and 100 μg/ml of Purp@COP. (B) Heating curve after irradiation with 1 W/cm2 laser with or without 50 μg/ml of Purp@COP in a common culture dish. (C) Heating results of Purp@COP under laser (1 W/cm2) irradiation. (D) The heating results of different concentrations of Purp@COP under laser (1 W/cm2) irradiation. The symbols "**", "****" showed that the p value is less than 0.05,while "ns" showed p>0.05.

