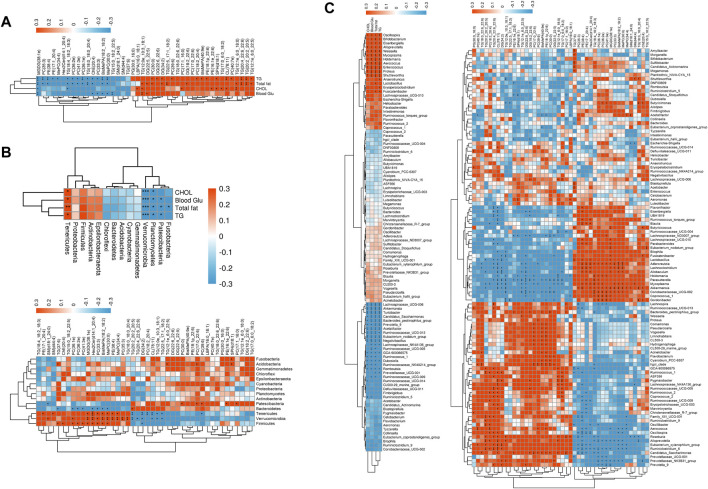
FIGURE 11.
BYHWD improved the metabolic pattern and the level of the differential lipids induced by the T2DM model: (A) the heatmap of the differential lipids between the DM and DM + BYHWD groups; (B) the heatmap of the differential lipids between the DM and DM + DMBG groups; (C) KEGG enrichment pathways of significant differential lipids in the DM + BYHWD group when compared with that in the DM group; (D) significant metabolic pathways map in the DM + BYHWD group when compared with that in the DM group.

