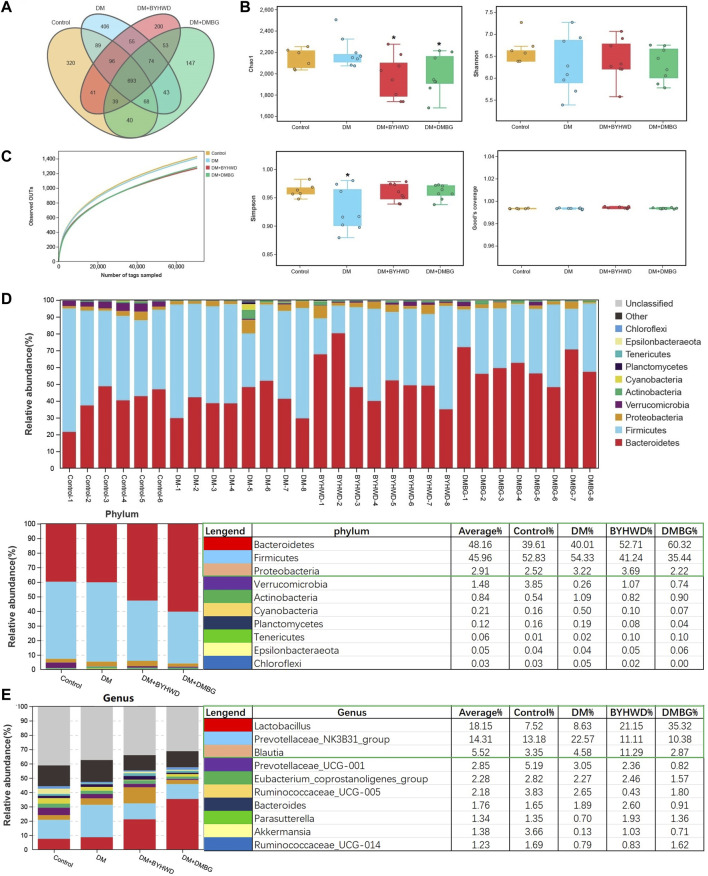
FIGURE 4.
Influences of BYHWD on gut microbiota in diabetic ZDF rats: (A) Venn analysis; (B) alpha-indexes of Chao1, Shannon, Simpson, and Good’s coverage comparison among the four groups; (C) observed OTUs; (D) the histogram of the top 10 phyla of the relative abundance of the intestinal flora; (E) the histogram of the top 10 genera of the relative abundance of the intestinal flora. Data are shown as means ± S.D (n = 6–8). Statistical analysis was performed using one-way ANOVA, followed by Tukey’s multiple comparisons test for the false discovery rate. *p < 0.05 and **p < 0.01 were set to compare the mean of each group with the mean of the DM group.

