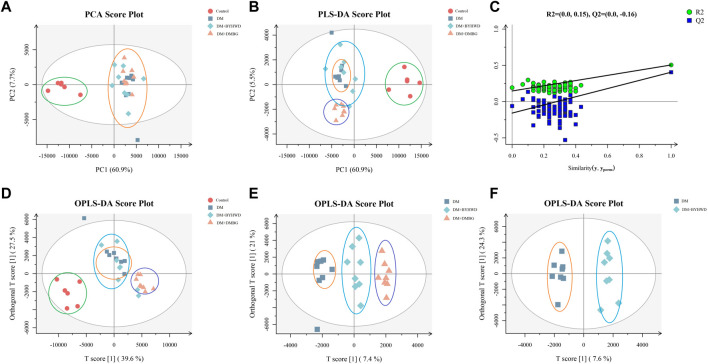
FIGURE 9.
BYHWD affected the lipid metabolism displayed by multivariate statistical analysis: (A) PCA plots of the four study groups; (B) PLS-DA plots of the four groups; (C) permutations plots of the four study groups; (D) OPLS-DA plots of the four study groups; (E) OPLS-DA plots of DM, DM + BYHWD, and DM + DMBG groups; (F) OPLS-DA plots of the DM and DM + BYHWD groups. The red circle represents the rat’s sample from the control group; the deep-blue square represents the rats’ samples from the DM group; the light-blue diamond represents the rats’ samples from the DM + BYHWD group, and the orange triangle represents the rats’ samples from the DM + DMBG group.

