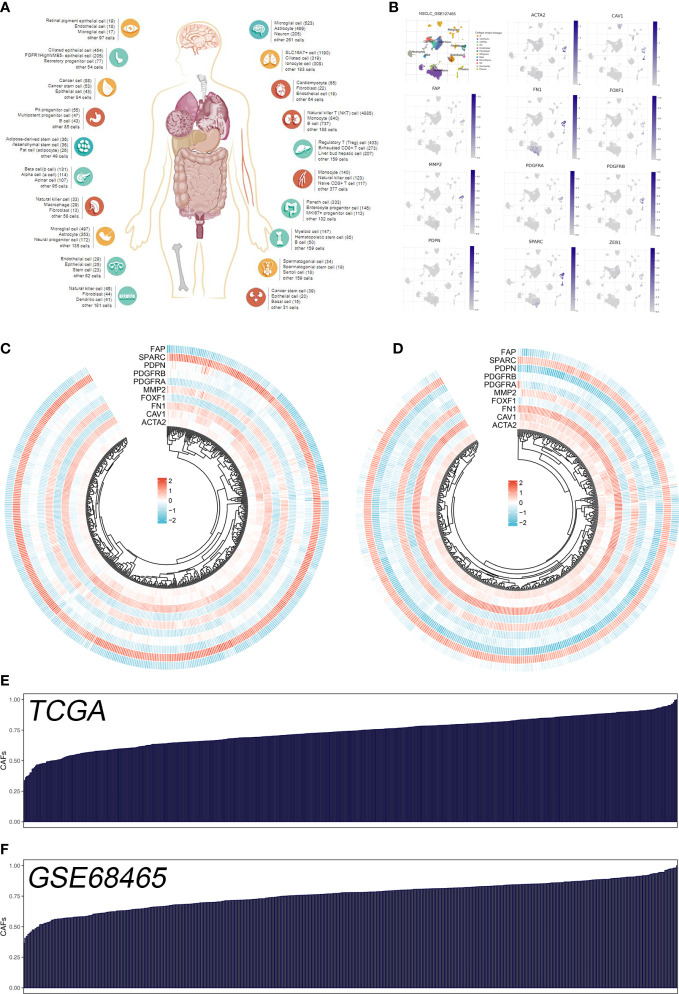
Figure 1.
Quantification of the CAFs infiltration based on identified markers. (A) The human single-cell atlas from the online website Cell Marker, http://bio-bigdata.hrbmu.edu.cn/CellMarker/; (B) The expression map of marker genes in different subgroup cells; (C) The heatmap demonstrated the expression of CAFs marker genes in TCGA cohort; (D) The heatmap demonstrated the expression of CAFs signature genes in GSE68465 cohort; (E) CAFs score in TCGA cohort quantified by ssGSEA; (F) CAFs score in GSE68465 cohort quantified by ssGSEA.

