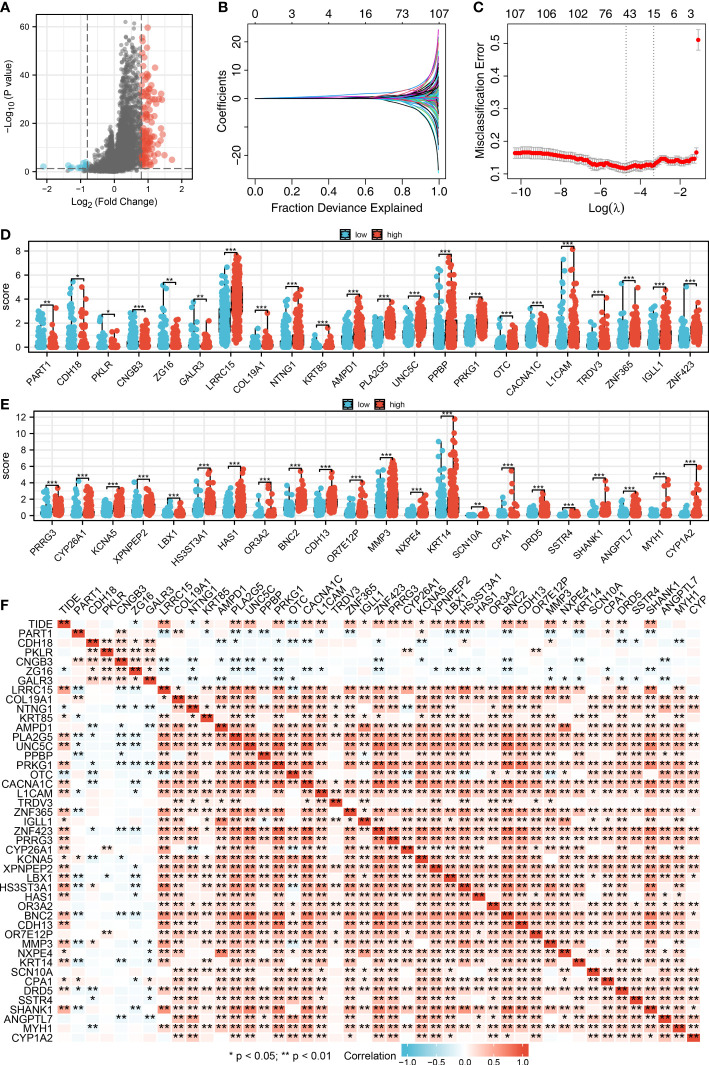
Figure 3.
Identification of characteristic molecules of lung cancer immunotherapy. (A) The volcano map demonstrated the differential expressed genes between high- and low-CAFs groups; (B-C) Logistic lasso regression; (D-E) The expression level 44 CAF characteristic genes in patients with high- and low-CAFs infiltration, *P < 0.05, **P < 0.01, ***P < 0.001; (F) The correlation analysis between 44 CAF-related signatures and TIDE score, *P < 0.05, **P < 0.01.

