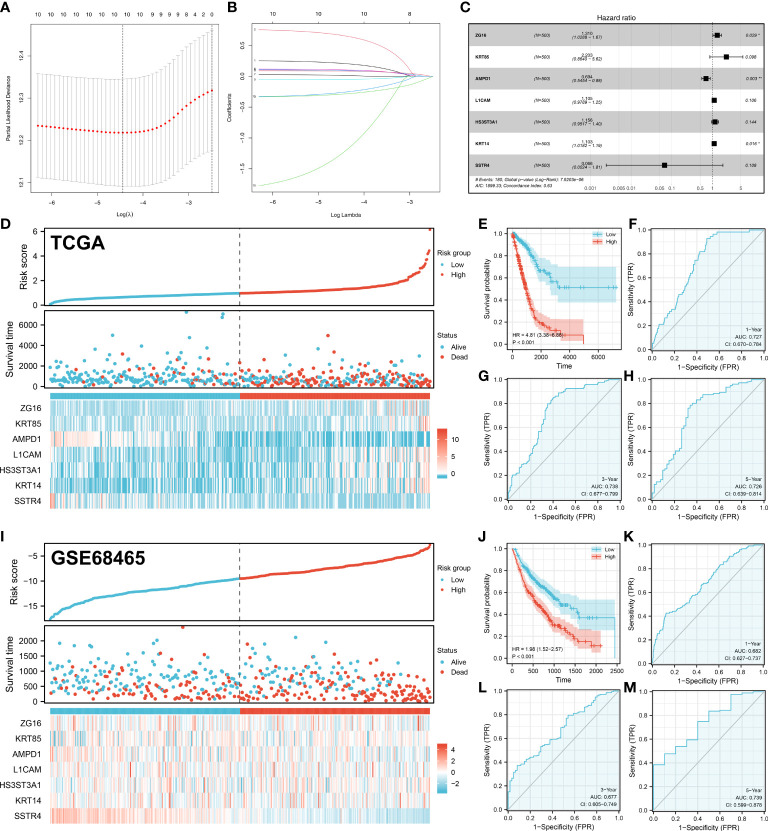
Figure 4.
Prognosis model construction. (A-B) The lasso regression analysis was used for data dimension reduction; (C) A prognosis signature consisting of characteristic molecules was constructed by multivariate cox regression analysis; (D) LUAD patients involved in TCGA cohort was divided into low-risk and high-risk groups based on the median cut-off; (E) The Kaplan-Meier curve was used to demonstrate the OS between low-risk and high-risk groups in TCGA cohort; (F) The time-dependent ROC curves reveals the 1-year predictive value of prognostic in TCGA cohort; (G) The time-dependent ROC curves reveals the 3-year predictive value of prognostic in TCGA cohort; (H) The time-dependent ROC curves reveals the 5-year predictive value of prognostic in TCGA cohort; (I) LUAD patients involved in GEO cohort was divided into low-risk and high-risk groups based on the median cut-off; (J) The Kaplan-Meier curve was used to demonstrate the OS between low-risk and high-risk groups in GEO cohort; (K) The time-dependent ROC curves reveals the 1-year predictive value of prognostic in GEO cohort; (L) The time-dependent ROC curves reveals the 3-year predictive value of prognostic in GEO cohort; (M) The time-dependent ROC curves reveals the 5-year predictive value of prognostic in GEO cohort;. *P < 0.05, **P < 0.01.

