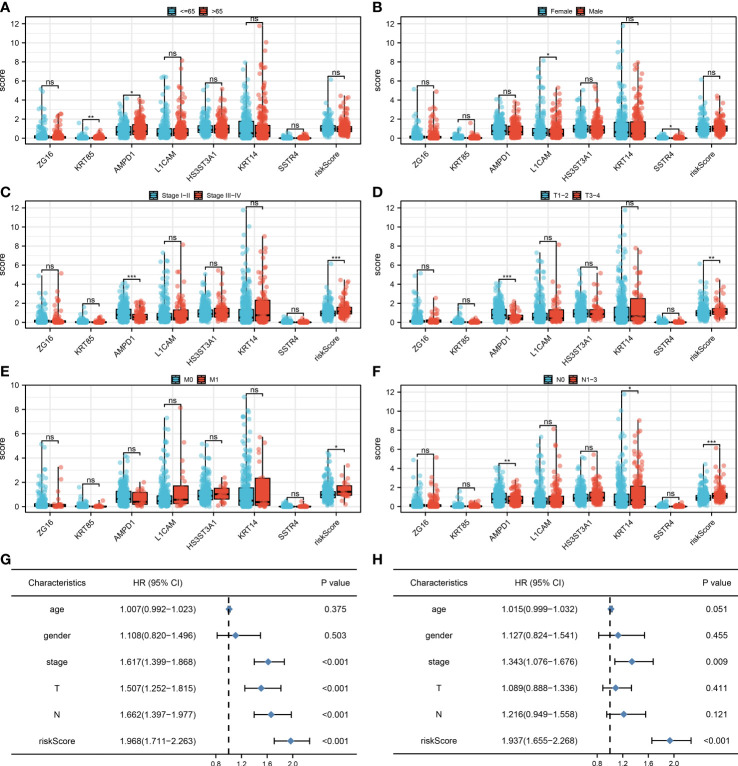
Figure 5.
Clinical correlation. (A) The correlation analysis between age and expression level of seven characteristic molecules, ns P > 0.05, *P < 0.05, **P < 0.01; (B) The correlation analysis between gender and expression level of seven characteristic molecules, ns P > 0.05, *P < 0.05; (C) The correlation analysis between stage and expression level of seven characteristic molecules, ns P > 0.05, ***P <0.001; (D) The correlation analysis between T stage and expression level of seven characteristic molecules, ns P > 0.05, **P < 0.01, ***P <0.001; (E) The correlation analysis between M stage and expression level of seven characteristic molecules, ns P > 0.05, *P < 0.05; (F) The correlation analysis between N stage and expression level of seven characteristic molecules, ns P > 0.05, *P < 0.05, **P < 0.01, ***P <0.001; (G) The univariate independent prognostic analysis revealed that stage, T stage, N stage and risk score are independent prognostic factors in LUAD patients; (H) The multivariate independent prognostic analysis reveals that stage and risk score are independent prognostic factors in LUAD patients.

