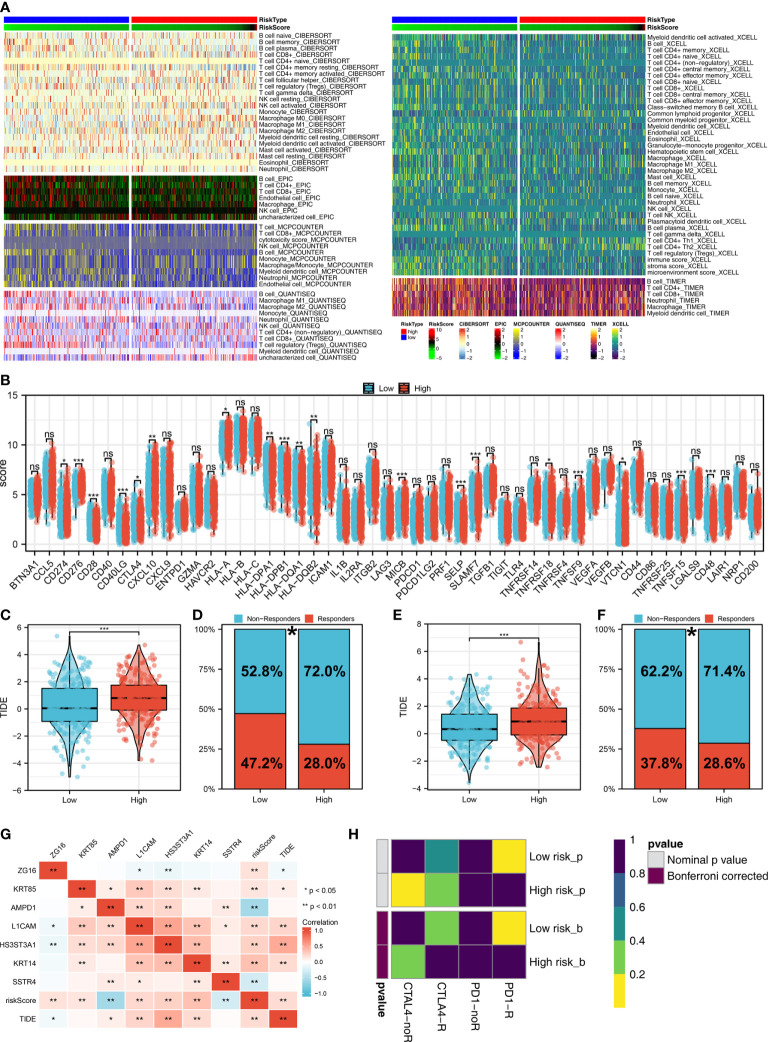
Figure 6.
Immune-related analysis. (A) The correlation between risk score and various immune scores; (B) The expression level of immune-related genes in low- and high-risk groups, ns P > 0.05, *P < 0.05, **P < 0.01, ***P < 0.001; (C) The level of TIDE score in low- and high-risk groups in the TCGA cohort, ***P < 0.001; (D) Percentage of immunotherapy responders and non-responders in patients with high and low risk score (TCGA cohort), *P < 0.05; (E) T The level of TIDE score in low- and high-risk groups in the GSE68465 cohort, ***P < 0.001; (F) Percentage of immunotherapy responders and non-responders in patients with high and low risk score (GSE68465 cohort), *P < 0.05; (G) The correlation analysis between TIDE score, risk score and seven characteristic molecules, *P < 0.05, **P < 0.01; (H) The correlation analysis between risk score and the immunotherapy response of PD-1 and CTLA4.

