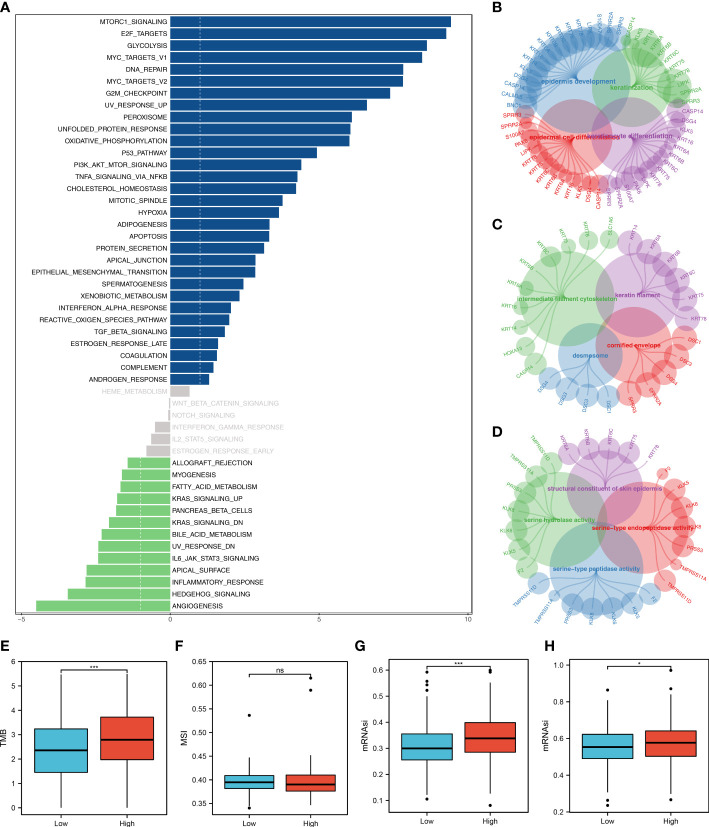
Figure 7.
Biological enrichment analysis. (A) The GSVA analysis between low- and high-risk groups; (B) The GO-BP enrichment analysis of our model; (C) The GO-CC enrichment analysis of our model; (D) The GO-MF enrichment analysis of our model; (E) The boxplot demonstrated the TMB score in low- and high-risk groups, ***P < 0.001; (F) The boxplot demonstrated the MSI score in low- and high-risk groups, ns P > 0.05; (G) The boxplot demonstrated the mRNAsi score in low- and high-risk groups, ***P < 0.001; (H) The boxplot demonstrated the EGFR-mRNAsi score in low- and high-risk groups, *P < 0.05.

