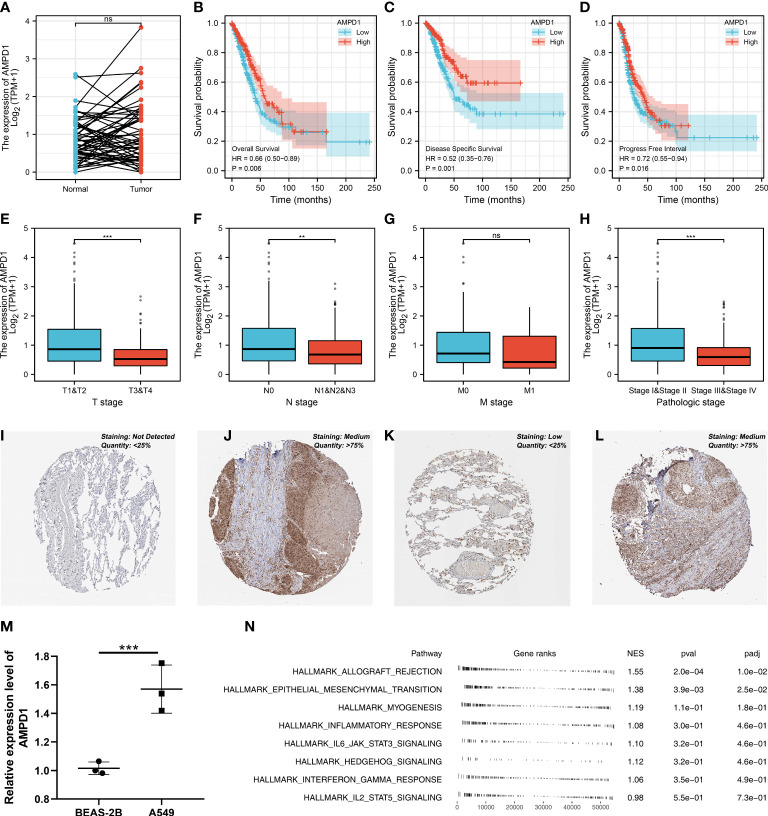
Figure 8.
Further exploration of AMPD1 in lung cancer. (A) The expression level of AMPD1 in paired LUAD and control tissue, ns P > 0.05; (B) The OS in patients with low and high AMPD1 expression level; (C) The DSS in patients with low and high AMPD1 expression level; (D) The PFI in patients with low and high AMPD1 expression level; (E) The correlation analysis between expression level of AMPD1 and T stage, ***P <0.001; (F) The correlation analysis between expression level of AMPD1 and N stage, **P < 0.01; (G) The correlation analysis between expression level of AMPD1 and M stage, ns P > 0.05; (H) The correlation analysis between expression level of AMPD1 and stage, ***P < 0.001; (I) The AMPD1 protein level in normal lung tissue; (J) The AMPD1 protein level in LUAD tissue; (K) The AMPD1 protein level in normal lung tissue; (L) The AMPD1 protein level in LUAD tissue; (M) The qRT-PCR assay demonstrated the expression level of AMPD1 in A549 and BEAS-2B cells, ***P < 0.001; (N) The GSEA analysis of AMPD1.

