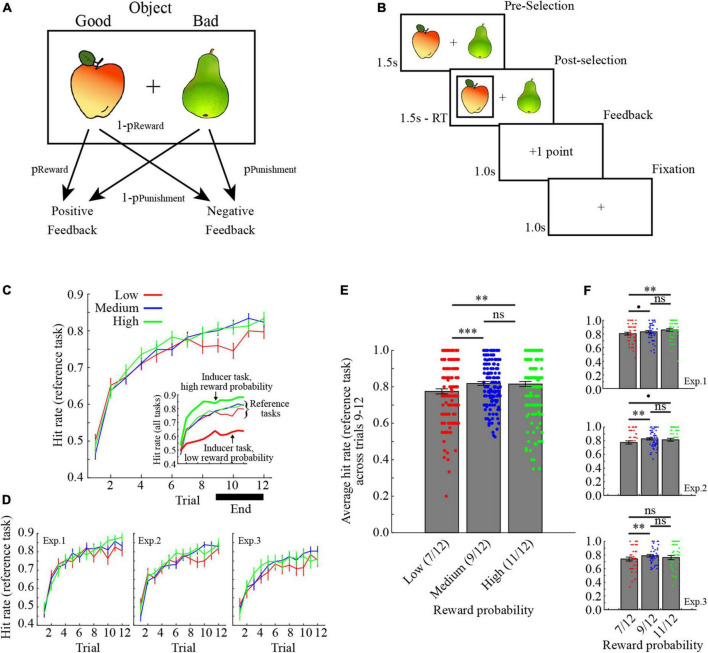
FIGURE 1.
Task description and learning performance. (A) In each trial, participants selected one of two options in a pair. One object provided positive feedback with probability pReward, while the other object provided negative feedback with probability pPunishment. Here, pReward was always equal to pPunishment. (B) Illustration of a trial. (C) Learning curves for the reference tasks, collapsed across the three experiments. The inset also shows performance for the inducer tasks with low- and high reward probabilities. Inducer/reference tasks are, respectively denoted by bold / narrow lines. (D) Learning curves for the reference task in the three experiments separately. (E) Average learning performance for the reference tasks across trials 9–12 collapsed across the three experiments. (F) Average learning performance for the reference tasks across trials 9–12 separately for the three experiments. ***p < 0.001, **p < 0.01, *p < 0.05, p < 0.10, ns p > 0.10. All error bars indicate the standard error of the mean.

