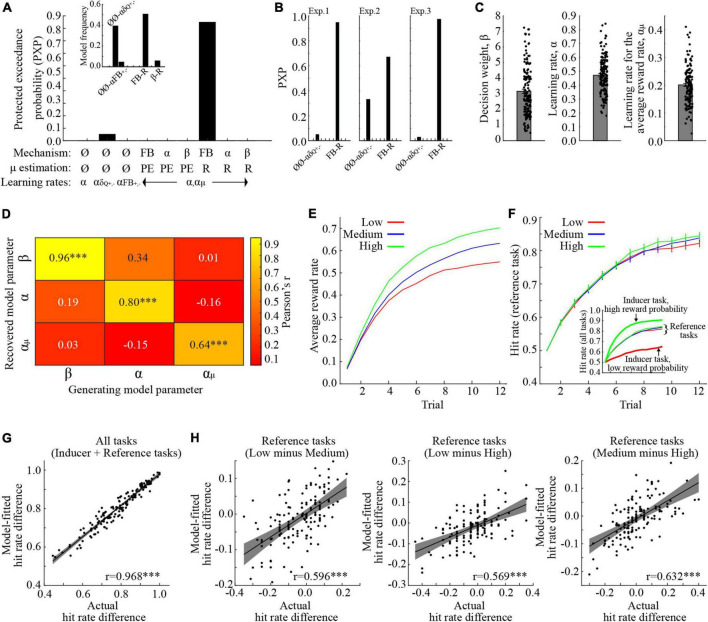
FIGURE 2.
Behavioral modeling. (A) Protected exceedance probabilities (PXP) when model parameters were fitted across all experiments. The highest PXP was obtained for the FB-R model, where the average reward feedback influences the prediction error component of the model. The inset shows the model frequencies. (B) PXP’s when model parameters were fitted in each experiment separately. In all experiments, the FB-R model had the highest PXP. (C) The model parameters, when fitted across experiments. (D) Correlation coefficients between model parameters used to generate behavior, and their recovered counterparts. (E) The average reward rate for the reference tasks in the different conditions. (F) Model-fitted hit rates for the reference tasks, collapsed across the three experiments. The inset also shows performance for the inducer tasks with low- and high reward probabilities. Inducer/reference tasks are, respectively denoted by bold / narrow lines. (G) Correlation between actual- and model-fitted learning performance, averaged across all conditions and tasks. (H) Correlations between actual- and model-fitted differences in learning performance for the reference task in the different conditions. ***p < 0.001. All error bars indicate the standard error of the mean.

