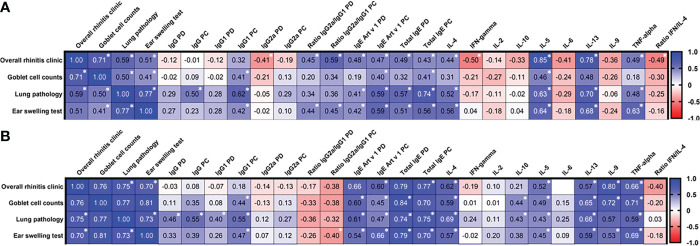
Figure 6.
Correlation matrix analysis between allergic rhinitis and bronchial asthma signs and humoral and cellular immune variables after pre- (A) and co-seasonal (B) ASIT regimens and challenge. The color refers to the r value scale (from -1 to 1) shown on the right. The number in each cell represents the actual r value. The analysis was performed using Pearson’s multivariate correlation method. Normalized data were used for this analysis. PD – post desensitization, PC – post challenge. *P <0.05.

