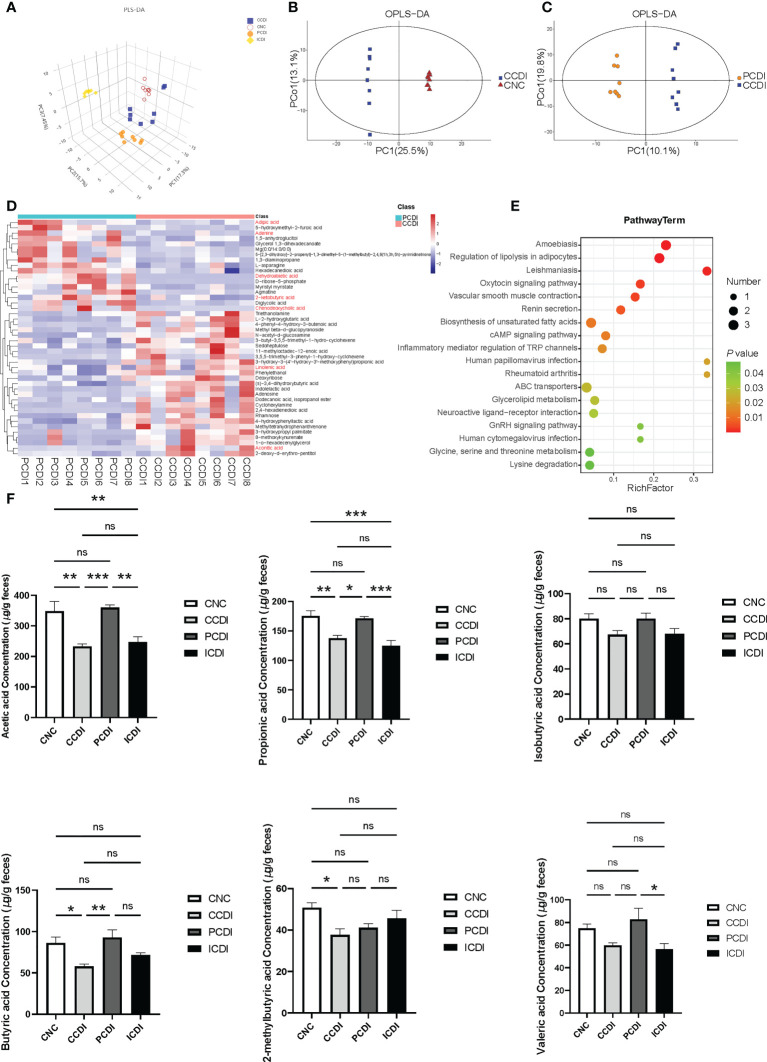
Figure 5.
Pectin attenuates C. difficile-induced dysregulation of the intestinal metabolome. (A) Three-dimensional PLS-DA score plots of metabolome profiles for the four groups. (B, C) OPLS-DA plots between groups. (D) Heatmap for the selected metabolites in the CCDI and PCDI groups. (E) Pathway of the differentially abundant metabolites between the CCDI and PCDI groups. (F) SCFA levels in the cecal contents of mice. *, P<0.05; **, P<0.01; ***, P<0.001; ns, differences are not significant. PLS-DA, Partial least squares discrimination analysis; OPLS-DA, orthogonal PLS-DA. The red color showed valuable differential metabolites.

