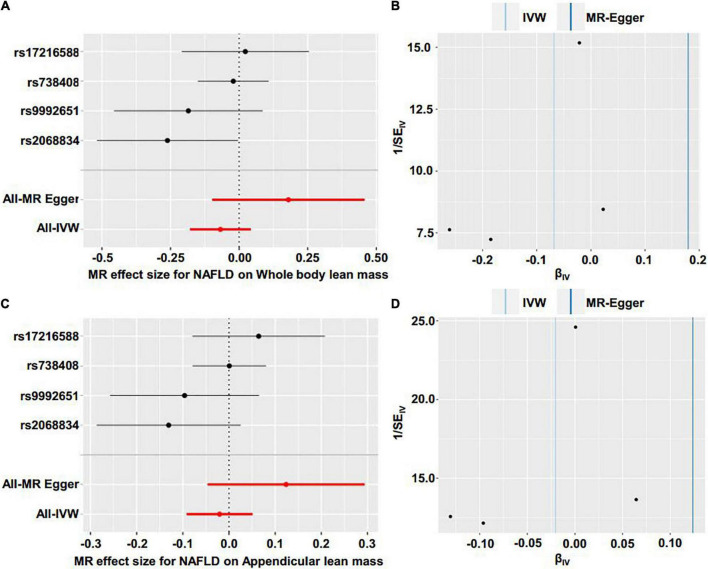
FIGURE 5.
Forest plot and funnel plot of the causal effect of NAFLD on lean body mass. (A) Forest plot of the causal effect of NAFLD on whole body lean mass. (B) Funnel plot of the causal effect of NAFLD on whole body lean mas. (C) Forest plot of the causal effect of NAFLD on appendicular lean mass. (D) Funnel plot of the causal effect of NAFLD on appendicular lean mass.

