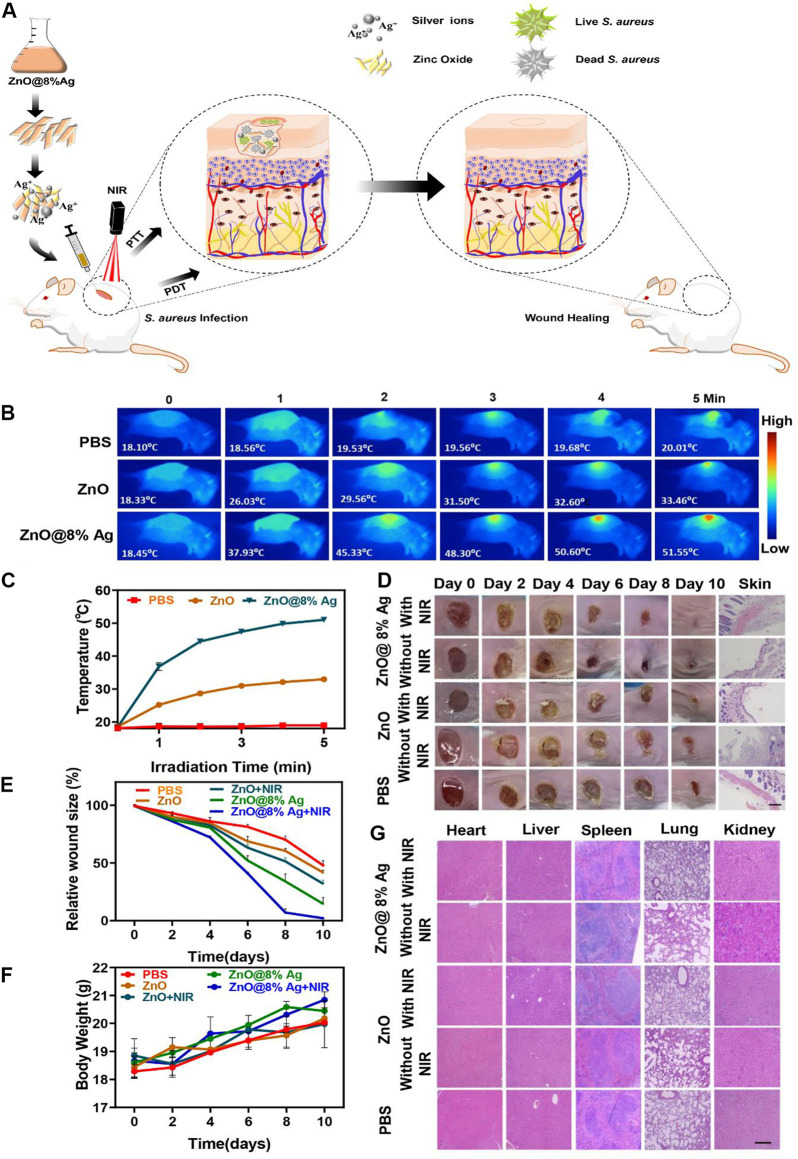
FIGURE 7.
In vivo antibacterial activity of ZnO@8%Ag. (A) Schematic illustration of the fabricated ZnO@8%Ag and the corresponding antibacterial effect in vivo under PTT and PDT, (B) thermal images of PBS, ZnO, and ZnO@8%Ag under NIR irradiation (808 nm, 2 W/cm2, 5 min), (C) temperature variation curve corresponding to (B), (D)representative images of S. aureus infected wound after treatment, (E) quantitative curve of the wound size over time for the treatment groups, (F) bodyweight variation curve for the different treatment groups over time, and (G) tissue slices of major organs (the heart, liver, spleen, lung and kidney) stained with H&E, after treatment, scale bar 100 µm.

