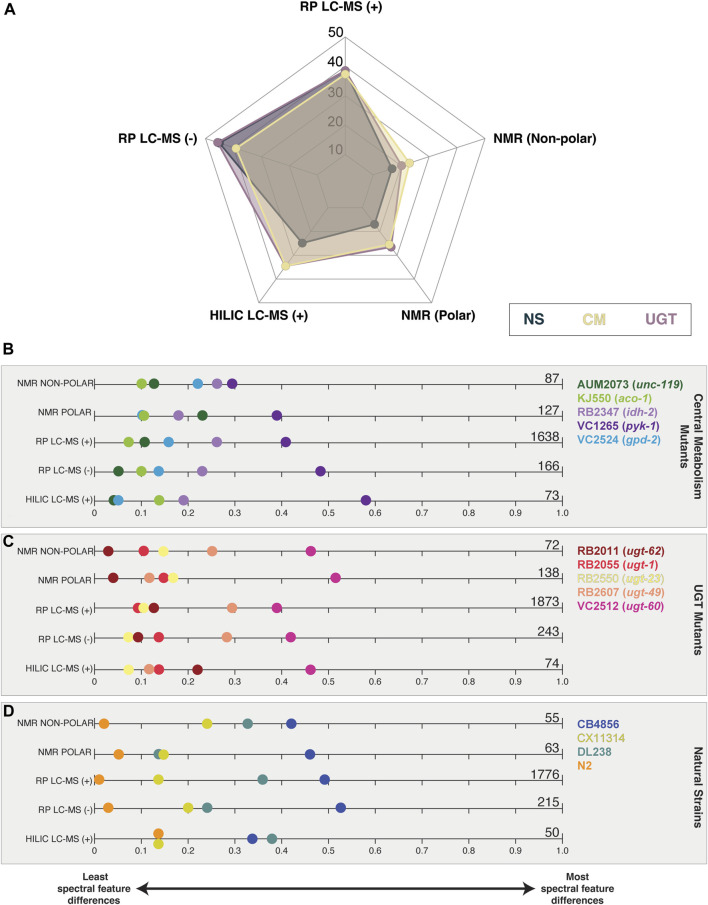
FIGURE 3.
Summary of significant spectral features found in each analytical platform and across the three studies. (A) Percent of significant features. The total number of significant features in all strains, by study, is used as the denominator for each of the five technologies. Significant spectral features identified in at least one strain by study are displayed for (B) central metabolism mutants, (C) UGT mutants, and (D) natural strains. Zero indicates the strain has no significant spectral feature differences from PD1074, while one indicates that all spectral feature differences from PD1074 are present in that strain. Significant feature totals are summarized at the end of the plot and detailed in Table 1.

