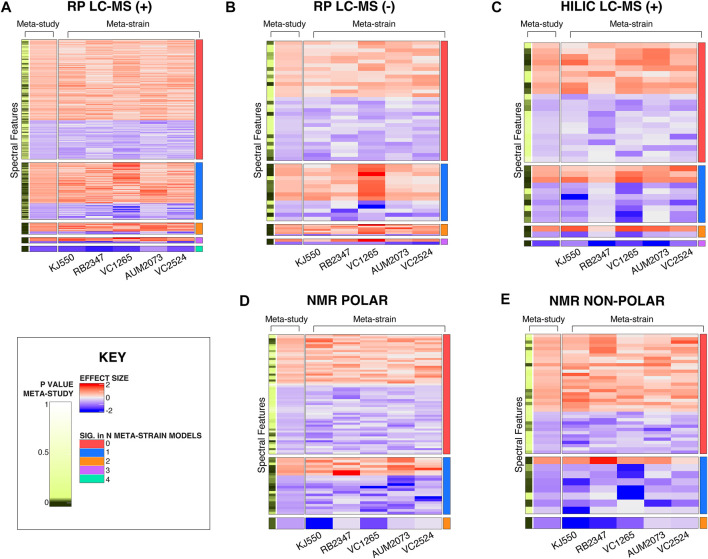
FIGURE 6.
Heatmaps of significant spectral features in the CM mutant study. (A) RP LC-MS positive mode (B) RP LC-MS negative mode (C) HILIC LC-MS positive mode (D) NMR polar and (E) NMR non-polar. The first two columns pertain to the meta-study results. The left-most column indicates the significant features found in the meta-study model, followed by the estimated effect size in the meta-study model across CM mutants. The following five columns are the effect sizes for individual strains, and the contents of the cell are the estimates of the effect of that strain (column), for that feature (row) compared to PD1074 from the meta-strain model. Features where the effect sizes are consistent for all strains are included. The effect sizes range from (2 to -2). Positive effect sizes (i.e., the strain had a higher peak at that given metabolic feature than PD1074) are displayed in red. Negative effect sizes (i.e., PD1074 had a higher peak at that given metabolic feature than the test strain) are displayed in blue. The right-most column indicates the number of strains in which a given spectral feature is statistically significant.

