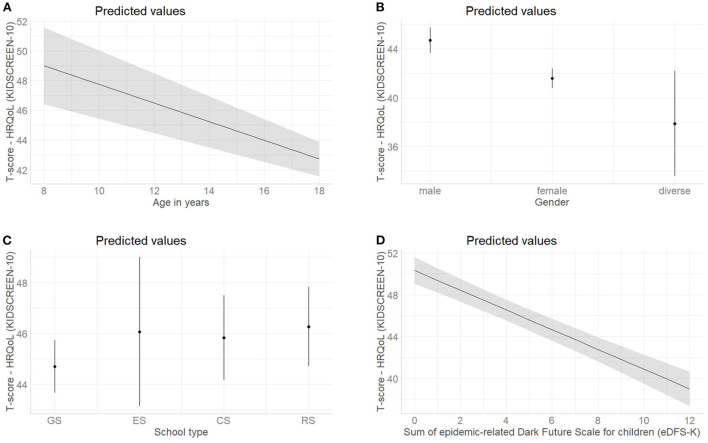
Figure 1.
Marginal effect plots with the predicted values and the 95% confidence interval of health-related quality of life (self-reported KIDSCREEN-10) for all predictors included in the multivariable model 1 (see Table 4, N = 787); (A) Estimated effect of age in years; (B) Estimated effect of gender; (C) Estimated effect of the school type, Abbr.: GS, grammar school; ES, elementary school; CS, comprehensive school; RS, regional school; (D) Estimated effect of sum of epidemic-related Dark Future Scale for children (eDFS-K). For continuous predictors, the gray lines and gray areas represent the estimated effect and 95% confidence interval, while for nominal variables this is represented by dots and dashes.

