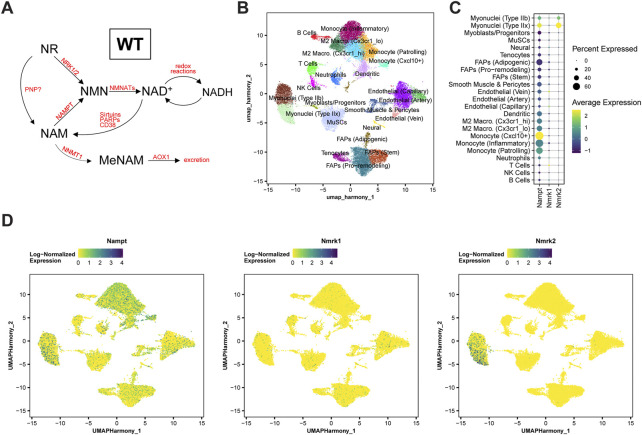
FIGURE 1.
Nampt, Nmrk1, and Nmrk2 expression dynamics in WT skeletal muscle. (A) Main NAD+ biosynthesis and consumption pathways in WT skeletal muscle. (B–D) Single-cell RNA-sequencing analysis of a notexin injury response in TA muscle of adult mice. TA muscle samples from 0, 1, 2, 3.5, 5, or 7 days post-injury (dpi) were analyzed from McKellar et al. (McKellar et al., 2021). (B) UMAP projection of scRNAseq data demonstrating cell-type annotations of clusters. (C,D) Dot plots (C) and UMAP projections (D) showing expression of Nampt, Nmrk1, and Nmrk2 by cell-type cluster. Dot size shows the frequency of cells expressing non-zero transcript level. Dot color shows average expression level.

