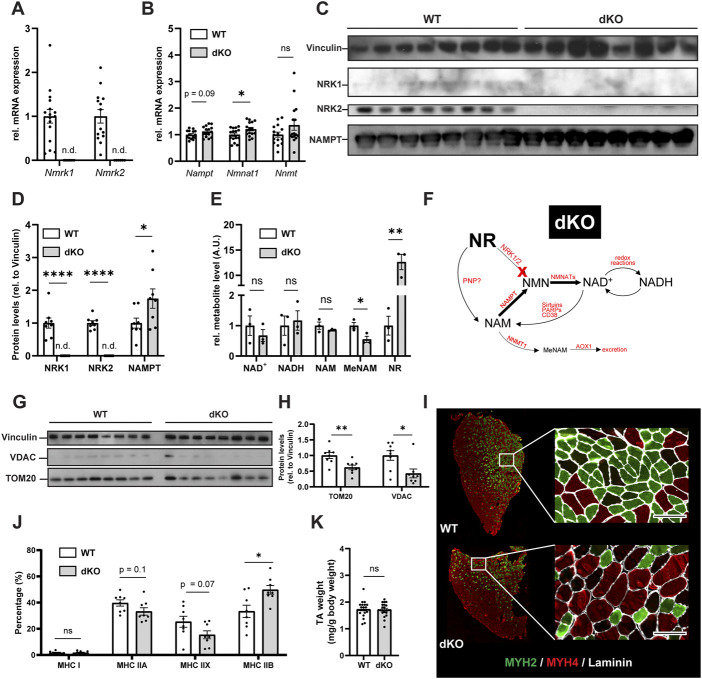
FIGURE 2.
NRKdKO alters the NAD+ metabolome, impairs mitochondria and induces a shift to fast glycolytic fiber types. (A,B) mRNA expression levels of NR converting enzymes (A) and of the major skeletal muscle NAD+ biosynthesis (Nampt, Nmnat1) and NAM excretion (Nnmt) enzymes (B). Gene expression of mRNA extracted from TA muscle relative to Atp5b, Eif2a, and Psmb4 as housekeeping genes. n = 16. (C,D) Representative immunoblot images (C) and quantification (D) by densitometry analysis of NRK1/2 and NAMPT in WT in NRKdKO muscles. n = 8. (E) LC-MS/MS qualitative metabolomics targeted to NAD+, NADH, NAM, MeNAM, and NR in GC muscle. Shown are qualitatively measured metabolite levels relative to WT, peak area normalized to an internal standard and mg protein per sample. n = 3. (F) Proposed mechanism for altered NAD+ biosynthesis and utilization in NRKdKO muscle. NAM salvage to NAD+ is increased at the expense of NAM excretion. (G,H) Representative immunoblot images (G) and quantification (H) by densitometry analysis of VDAC and TOM20 in WT and NRKdKO muscles. n = 8. (I,J) Representative immunofluorescence images (I) and quantification (J) of fiber types in WT and NRKdKO TA muscle sections. Myh2 (Type IIA), green; Myh4 (Type IIB), red; laminin, gray. Scale bar, 100 µm n = 8. (K) TA wet weight from WT and NRKdKO mice. n = 16. Results shown are mean ± s. e.m. with *p < 0.05, **p < 0.01, ****p < 0.0001 versus WT, determined by unpaired Student’s t-test.

