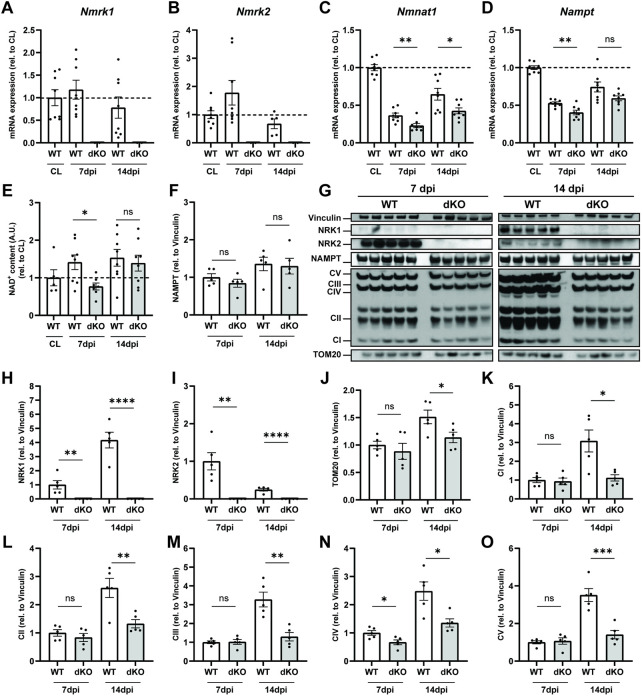
FIGURE 5.
NRKdKO delays regeneration of NAD+ levels and mitochondrial bioenergetics after muscle injury. Muscle regeneration was performed as represented in Figure 4. (A–D) Nmrk1 (A), Nmrk2 (B), Nmnat1 (C) and Nampt (D) mRNA expression at 7 and 14 dpi measured by qPCR relative to Atp5b, Eif2a, and Psmb4 as housekeeping genes, n = 8. (E) Relative NAD+ levels in TA muscle measured by cycling assay. (F–O) Representative immunoblot images and quantification by densitometry analysis of NAD+ salvage enzymes (F–I) and mitochondrial markers (J–O), n = 5. Results shown are mean ± s. e.m. with *p < 0.05, **p < 0.01, ***p < 0.001, ****p < 0.0001 versus WT determined by unpaired Student’s t-test. CL contralateral uninjured muscle.

