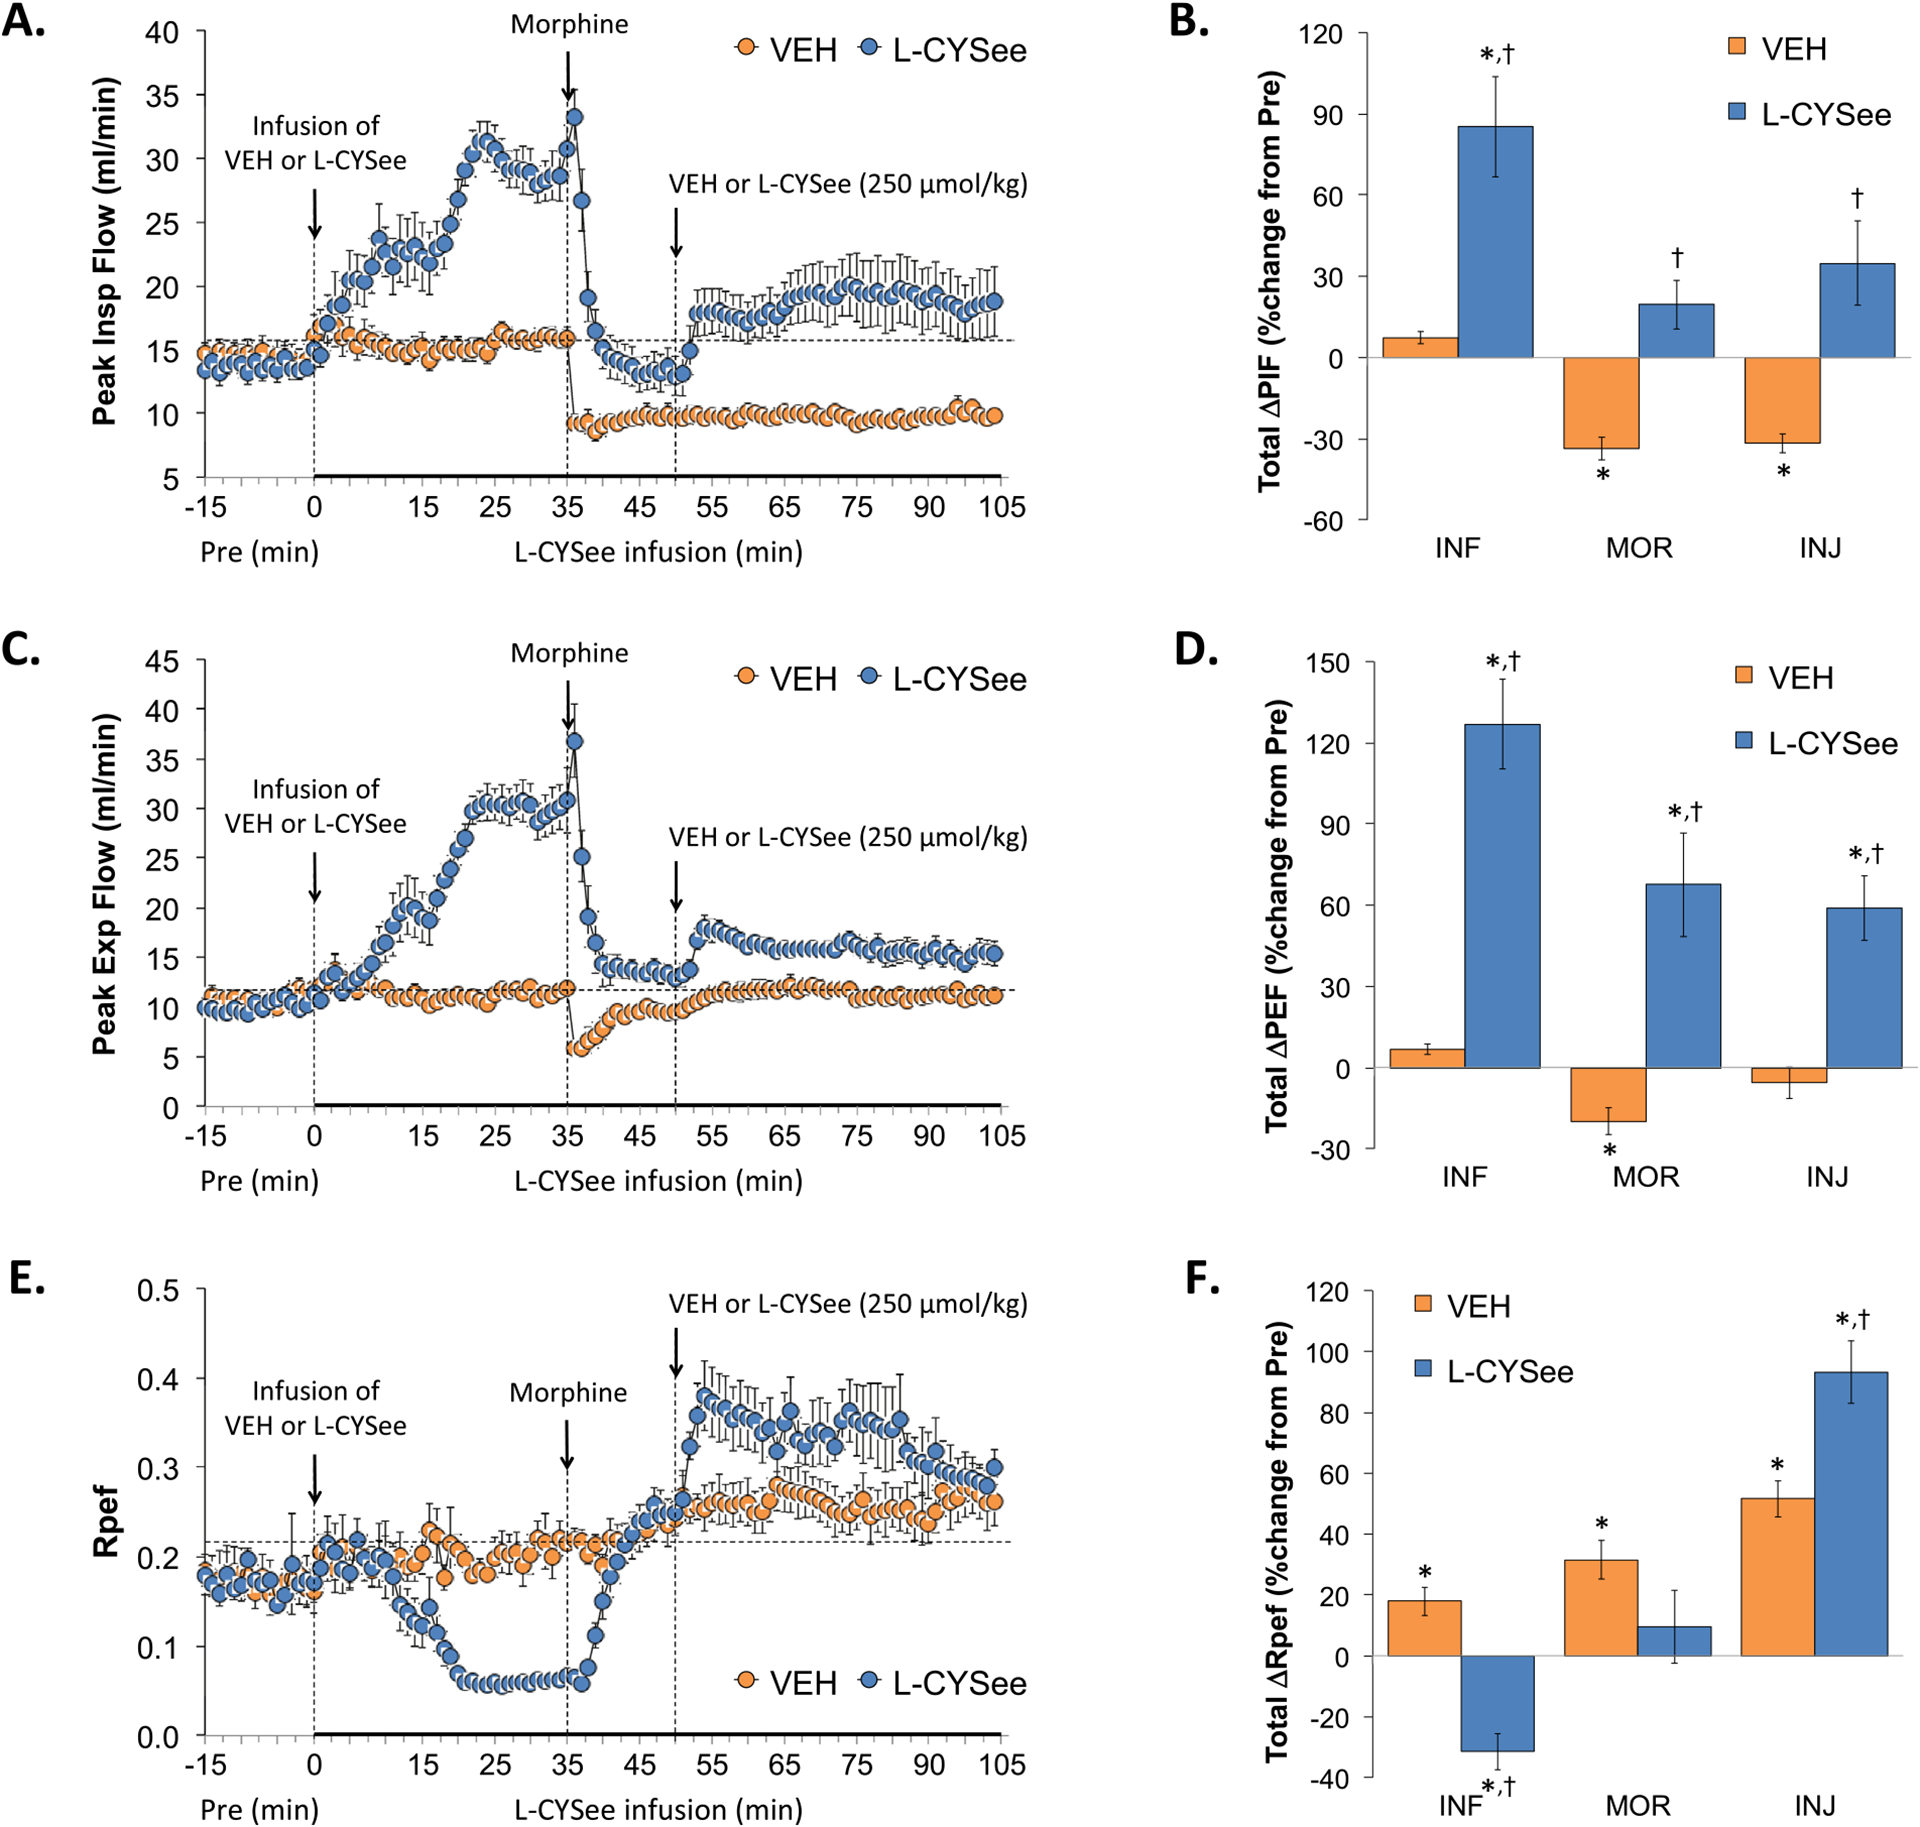
Fig. 4.

Changes in peak inspiratory flow (PIF), peak expiratory flow (PEF), and rate of achieving PEF (Rpef). Panels A, C, and E: Actual PIF, PEF, and Rpef values during the various stages of the experiment, respectively. Panels B, D, and F: Sum of the PIF, PEF, and Rpef responses recorded during the infusion of vehicle (VEH; 20 μL/min, IV) or L-CYSee (INF; 14.3 μmol/kg/min, IV), upon injection of morphine (MOR, 10 mg/kg, IV) and following injection of VEH (100 μL/100 g body weight, IV) or L-CYSee (250 μmol/kg, IV), respectively. Data are presented as mean ± SEM. There were 5 rats in the vehicle-infusion group and 6 rats in the L-CYSee-infusion group.*P < 0.05, significant change from Pre values. †P < 0.05, L-CYSee versus VEH.
