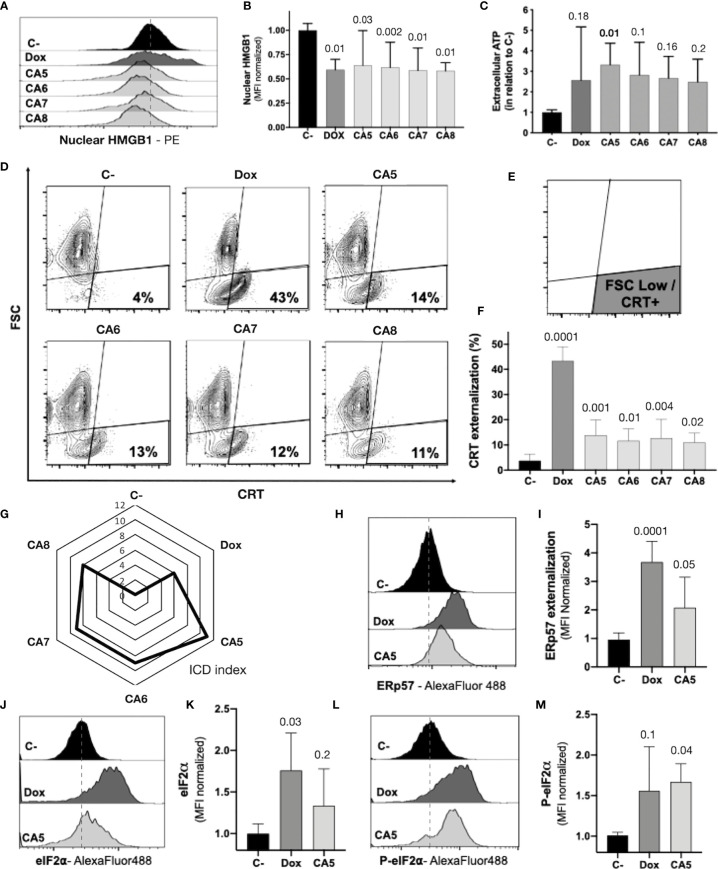
Figure 4.
Chromomycins A5-8 induce the release of immunogenic cell death DAMPs. B16-F10 melanoma cells were treated with DMSO (C-), as a negative control, doxorubicin (Dox), as a positive control, and CA5-8 (CA5-8) for 24 h. (A) Representative histograms of nuclear HMGB1 evaluated by flow cytometry and (B) graph depicting normalized median fluorescence intensity (MFI) of nuclear HMGB1. (C) Normalized extracellular ATP levels measured by luminescence. (D) Representative contour plot graphs of calreticulin (CRT) vs cell size (forward scatter, FSC) by flow cytometry, (E) Illustration of the gated region of CRT+ cells with low FSC and (F) graph depicting the percentage of CRT+ cells. (G) Radar graph of the index of immunogenic cell death (ICD index). Details of ICD index are described in SI.2. (H) Representative histograms of ERp57 evaluated by flow cytometry and (I) graph depicting normalized MFI of ERp57. (J) Representative histograms of eIF2α evaluated by flow cytometry and (K), graph depicting normalized MFI of eIF2a. (L) Representative histograms of cells with eIF2α phosphorylated at serine 51 (P-eIF2α) evaluated by flow cytometry and (M) graph depicting normalized MFI of P-eIF2a. Data presented in graphs as mean ± standard deviation of 3 independent experiments performed in triplicate. The p values of C- compared to the treated groups are above each treated group.

