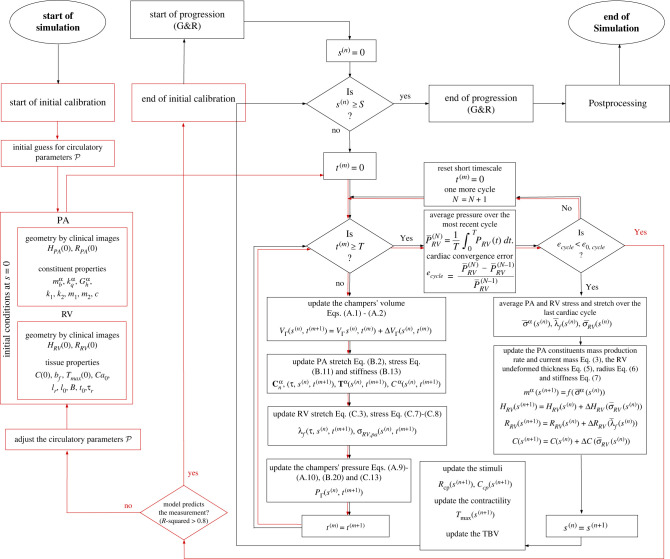
Figure 2.
A flowchart of the numerical structure based on which the computational framework is built. The initial calibration (red flowline) in the short timescale was performed to obtain the circulatory parameters that reproduce the clinical P–V relationship of the RV and PA. After the initial calibration, the progression simulation over the short timescale starts (black flowline) and at each long timescale step the short timescale simulation is run that determine the stress and stretches that determine the G&R of the PA and RV.

