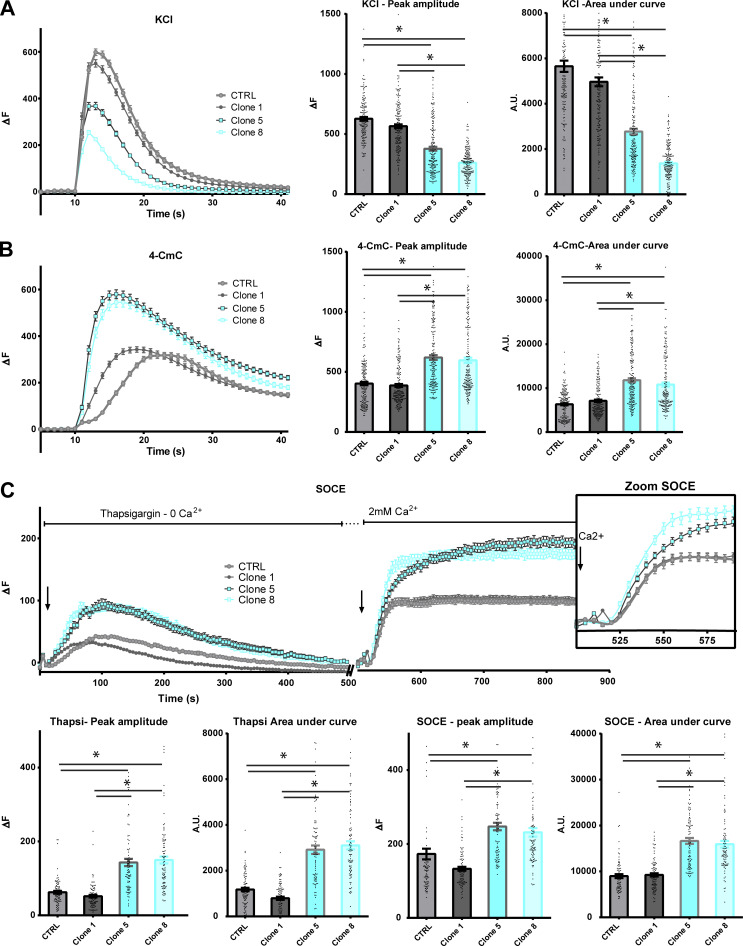
Figure 2.
Calcium imaging in CTRL or HTT-KO cultured human myotubes. All values are means ± SEM. In each condition, n = 90–180 myotubes have been analyzed, from at least three different experiments. Statistical significance was determined using ordinary one-way ANOVA with Tukey correction for multiple comparison. (A) KCl depolarization (110 mM) was induced in the presence of 2 mM external calcium. The left curves represent the fluorescence variation in control (gray curves) or HTT-KO myotubes (blue curves), produced from CTRL-HM, Clone 1 (CTRL), Clone 5 (HTT-KO), and Clone 8 (HTT-KO) cell lines. The histogram on the right presents the mean ± SEM of the peak of each curve (each dot represents one myotube) and the mean ± SEM area under the curve. For peak amplitude, Clone 5 versus CTRL P < 0.0001; Clone 8 versus CTRL P < 0.0001; Clone 5 versus Clone 1 P < 0.0001; Clone 8 versus Clone 1 P < 0.0001. For the area under the curve Clone 5 versus CTRL P < 0.0001; Clone 8 versus CTRL P < 0.0001; Clone 5 versus Clone 1 P < 0.0001; Clone 8 versus Clone 1 P < 0.0001. (B) 4-CmC (500 µM) was used to directly stimulate RyR in the presence of 2 mM external calcium. The left curves represent the fluorescence variation in control (gray curves) or HTT-KO myotubes (blue curves), produced from CTRL-HM, Clone 1 (CTRL), Clone 5 (HTT-KO), and Clone 8 (HTT-KO) cell lines. The histogram on the right presents the mean ± SEM of the peak of each curve (each dot represents one myotube) and the mean ± SEM area under the curve. For peak amplitude, Clone 5 versus CTRL P < 0.0001; Clone 8 versus CTRL P < 0.0001; Clone 5 versus Clone 1 P < 0.0001; Clone 8 versus Clone 1 P < 0.0001. For the area under the curve, Clone 5 versus CTRL P < 0.0001; Clone 8 versus CTRL P < 0.0001, Clone 5 versus Clone 1 P < 0.0001; Clone 8 versus Clone 1 P < 0.0001. (C) The amplitude of the SOCE was determined using a two-step stimulation. The cells were first exposed to thapsigargin (10 µM) in absence of extracellular calcium to induce slow extrusion of the SR calcium and estimate the amplitude of the calcium store, and the cells were subsequently exposed to 2 mM extracellular calcium to induce an influx of extracellular calcium by the STIM1–ORAI1 complex. The inset on the right is a zoom on the curves between 500 and 600 s, to better visualize the kinetics of calcium influx by STIM1–ORAI1 upon the addition of external calcium. The amplitude of the peak of thapsigargin-induced calcium release or the extracellular calcium influx, as well as the area under each curve, are presented below each curve. For the thapsigargin peak amplitude, Clone 5 versus CTRL P < 0.0001; Clone 8 versus CTRL P < 0.0001; Clone 5 versus Clone 1 P < 0.0001; Clone 8 versus Clone 1 P < 0.0001. For the thapsigargin area under the curve, Clone 5 versus CTRL P < 0.0001; Clone 8 versus CTRL P < 0.0001; Clone 5 versus Clone 1 P < 0.0001; Clone 8 versus Clone 1 P < 0.0001. For the SOCE peak amplitude, Clone 5 versus CTRL P < 0.0001; Clone 8 versus CTRL P < 0.0001; Clone 5 versus Clone 1 P < 0.0001; Clone 8 versus Clone 1 P < 0.0001. For the SOCE area under the curve, Clone 5 versus CTRL P < 0.0001; Clone 8 versus CTRL P < 0.0001; Clone 5 versus Clone 1 P < 0.0001; Clone 8 versus Clone 1 P < 0.0001.

