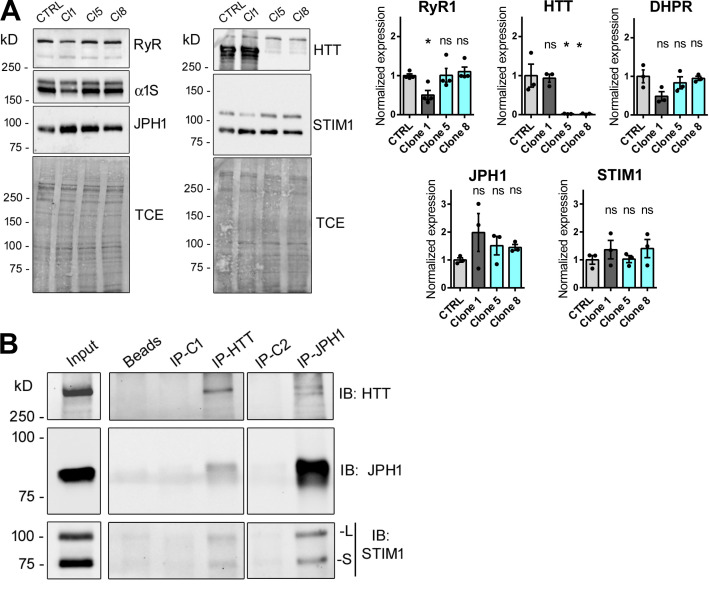
Figure 3.
Biochemical characterization of myotubes and muscle. (A) HTT-KO myotubes produced from CTRL-HM, Clone 1 (CTRL), Clone 5 (HTT-KO), and Clone 8 (HTT-KO) cell lines were analyzed by Western blot to quantify the amount of RyR1, HTT, α1 subunit of DHPR (the full length 210 kD and the truncated 170 kD are both observed), JPH1 (Invitrogen antibody), and STIM1 (STIM1L and STIM1S isoforms are both observed: cell signaling antibody), with the total amount of protein (TCE staining) as the loading control. The amount of each protein in Cl1, Cl5, and Cl8 was normalized to the amount in the CTRL-HM. Besides HTT, no modification has been observed in the amount of each protein between the control cells (CTRL-HM) and the HTT-KO groups, as illustrated in the quantification presented on the right panel, performed from three to four independent experiments. Statistical analysis: each clone versus CTRL was performed using one-way ANOVA with Dunnett’s correction for multiple comparison. Adjusted P value: RyR1 Clone 1 P = 0.0370, Clone 5 P = 0.9999, Clone 8 P = 0.8824; HTT Clone 1 P = 0.9808, Clone 5 P = 0.0057, Clone 8 P = 0.0056; DHPR Clone 1 P = 0.0587, Clone 5 P = 0.7092, Clone 8 P = 0.9844; JPH1 Clone 1 P = 0.2399, Clone 5 P = 0.6811, Clone 8 P = 0.7520; STIM1 Clone 1 P = 0.6329, Clone 5 P = 0.9999, Clone 8 P = 0.5676. (B) Immunoprecipitations were performed on WT mouse skeletal muscle homogenates (input) with antibodies against HTT (IP-HTT) or against JPH1 (IP-JPH1), or with their respective isotypic control antibody (IP-C1 as a control for IP-HTT and IP-C2 for IP-JPH1), or in absence of any antibody (beads). The Western blot of the immunoprecipitated proteins was performed with the antibodies mentioned on the right to detect HTT, JPH1, and STIM1 (both the long [L] and the short [S] isoform). The different panels presented were acquired in the same experiment with different exposition times to allow a good visualization of the different proteins. The images are representatives of three independent IP experiments. Source data are available for this figure: SourceData F3.

