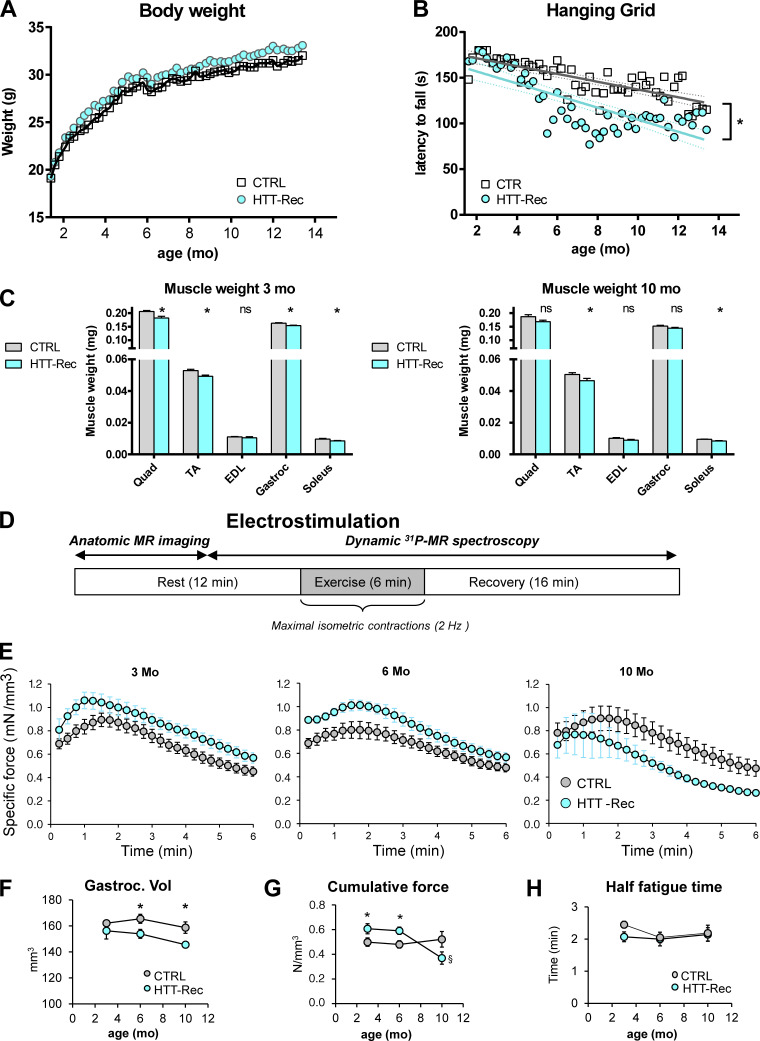
Figure 5.
Evolution of muscle strength of the HTT-Rec mice. (A and B) Evolution with the age of body weight and hanging grid task performance in CTRL and HTT-Rec mice. Data are presented as the mean of n = 9 mice/group. Statistical analysis: linear regression, P = 0.01142. (C). Muscle weight normalized to body weight in 3-mo-old CTRL (n = 5) or HTT-Rec (n = 4) and 10-mo-old CTRL (n = 6) or HTT-Rec (n = 6) male mice. Statistical analysis: Unpaired t test, HTT-Rec versus CTRL, at 3 mo Quad P = 0.0026, TA P = 0.0044, EDL P = 0.3659, Gastroc P = 0.0076, Sol P = 0.0384; at 10 mo Quad P = 0.0553, TA P = 0.0465, EDL P = 0.1175, Gastroc P = 0.0627, Sol P = 0.0014. (D) Protocol for the investigation of gastrocnemius muscle function and bioenergetics, performed on CTRL mice (n = 7 at each age) and HTT-Rec mice (n = 5 at 3 and 6 mo and n = 4 at 10 mo). Data are mean ± SEM. (E) Time course of specific force measured in vivo throughout the 6-min fatiguing bout of exercise at 3, 6, and 10-mo of age. (F) Gastrocnemius muscle volume measured from MR images: statistical analysis unpaired two-tailed Mann–Whitney t tests, HTT versus CTRL P = 0.030 at 6 mo and P = 0.029 at 10 mo. (G) The cumulative specific force, defined as the total amount of specific force produced during the whole 6-min exercise, was determined for each group. Statistical analysis was performed using unpaired two-tailed Mann–Whitney t tests. *, significant difference between HTT-Rec and CTRL groups at the same age (P = 0.048 at 3 mo, P = 0.019 at 10 mo); §, significant difference within the HTT-Rec group between 10 and 3 mo (P = 0.003), and 10 and 6 mo (P = 0.002). (H) Half-fatigue time, defined as the time required for the force to decline by half from its maximal value, is not significantly different in each group and at each age.

