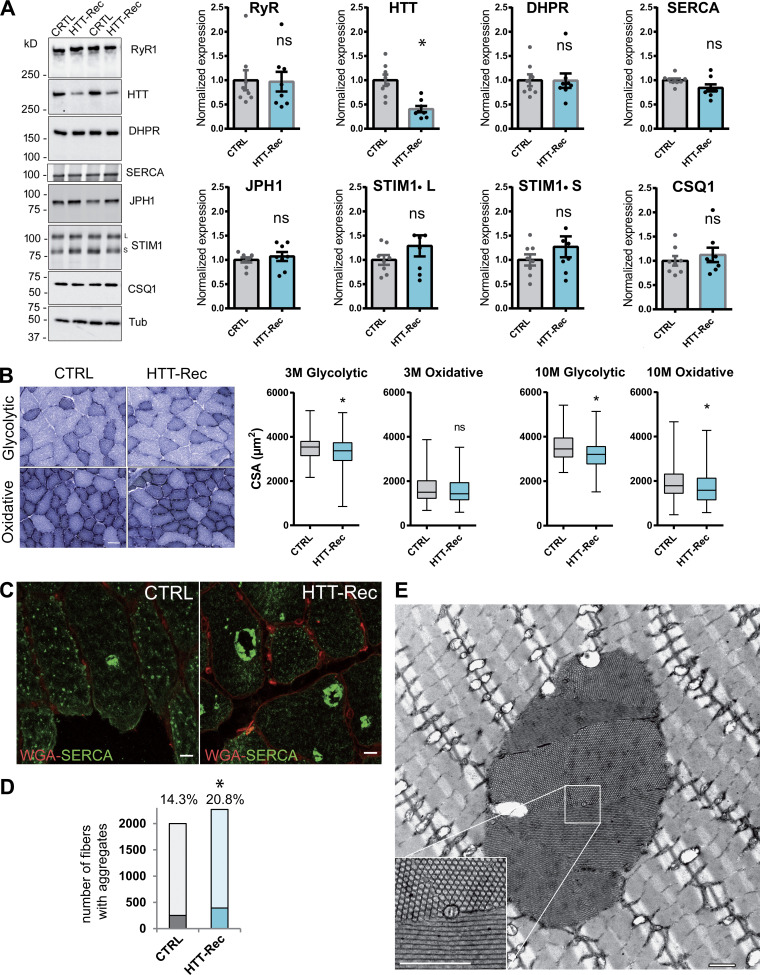
Figure 6.
Morphological characterization of the muscles of HTT-Rec mice. (A) Western blot analysis of RyR1, HTT, DHPR-α1S, JPH1, STIM1, SERCA, and CSQ1 in TA muscle homogenates from CTRL and HTT-Rec 10 mo old mice. Tubulin is the loading control. Eight mice per group, each dot represents a mouse, the value for each mouse is the mean of three Western blots. Statistical analysis: unpaired t test, HTT-Rec versus CTRL, RyR1 P = 0.9208, HTT P = 0.0006, DHPR P = 0.9681, JPH1 P = 0.5164, STIM1L P = 0.2478, STIM1S P = 0.2856, SERCA P = 0.0547, CSQ1 P = 0.5036. (B) The CSA was measured in glycolytic and oxidative fibers from CTRL and HTT-Rec TA muscle stained with NADH at 3 mo of age. Representative images of TA sections in regions enriched in glycolytic fibers or oxidative fibers in CRTL or HTT-Rec at 3 mo, are presented. Scale bar, 50 µm. Quantification has been performed on n = 375 fibers from three CTRL mice and n = 495 fibers from three HTT-Rec mice. Student’s t test, P = 0.0038 for glycolytic fibers and P= 0.1667 for oxidative fibers. CSA was measured in glycolytic and oxidative fibers from CTRL and HTT-Rec TA muscle stained with NADH at 10 mo of age, on n = 399 fibers from three CTRL mice and n = 450 fibers from three HTT-Rec mice. Student’s t test, P < 0.0001 for glycolytic fibers and oxidative fibers. (C) Representative confocal images of tubular aggregates in TA of 10 mo old CTRL and HTT-Rec mice using WGA (red) and SERCA (green). Scale bar, 10 µm. (D) The number of fibers containing SERCA aggregates was determined out of the total number of fibers (WGA staining) on n = 3–4 mice per genotype. Of note: the labeling of the aggregates with the SERCA antibody is so strong that the labeling of SERCA in the whole SR is not visible. The χ2 test was used to determine whether there was a significant difference between the frequencies of fibers with aggregates: CTRL, 251 out of 1,749 (14.3%); HTT-Rec, 392 out of 1,878 (20.8%); χ2 = 26.414, P < 0.0001. (E) Representative EM picture of longitudinal TA section of HTT-Rec mouse. Scale bar, 1 µm. Source data are available for this figure: SourceData F6.

