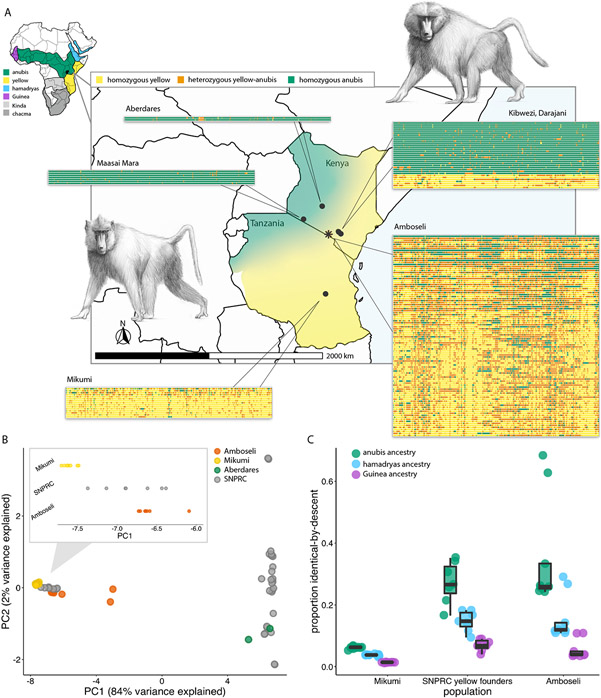
Figure 1: The structure of the baboon hybrid zone in Amboseli and the surrounding region.
(A) Geographic locations and local ancestry estimates for baboons in this study (black asterisk=Amboseli). For each population, each row corresponds to the first 20 Mb of chromosome 1 for one individual, organized vertically by global ancestry. For Amboseli, a subsample of 100 individuals is shown. Central map: ranges of yellow baboons and anubis baboons in Kenya and Tanzania; small map: ranges of all six African baboons (47), modified from a map by Kenneth Chiou (CC BY 3.0 license). Baboon drawings by Christopher Smith. (B) PCA of genotype data for high coverage genomes. Inset: distribution of “yellow-like” individuals along PC1. SNPRC yellow baboon founders resemble admixed Amboseli baboons. (C) IBDMix (26) results for three sets of yellow or majority yellow baboons. SNPRC yellow baboon founders and Amboseli baboons exhibit substantial identity-by-descent (IBD) with anubis baboons, while IBD estimates for Mikumi yellow and anubis baboons are low. The excess IBD in the SNPRC and Amboseli samples points to the contribution of gene flow beyond residual incomplete lineage sorting.

