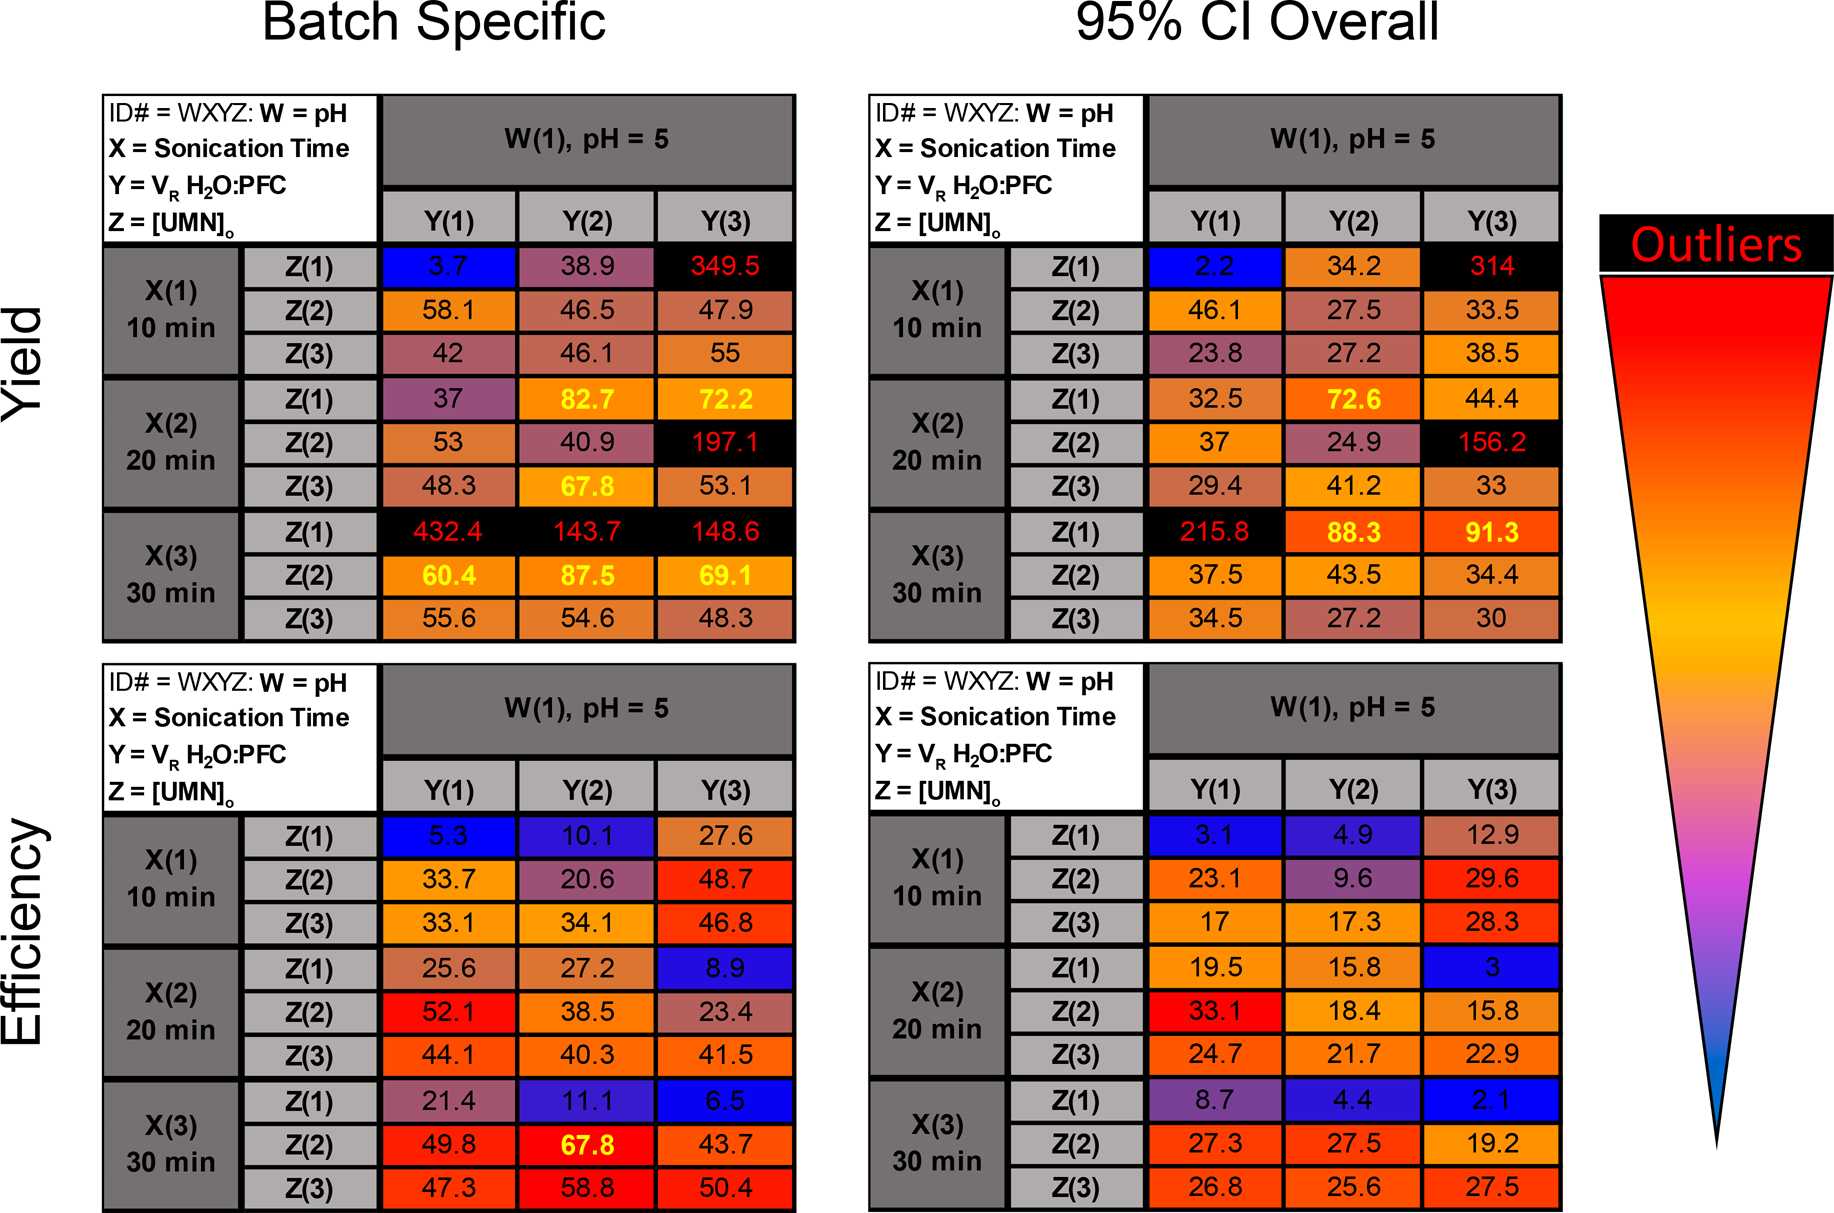
Figure 2.

Heat maps of loading yields and efficiencies for PFD PERFUMN generation. Each spot is coded by a 4-digit number with positions “WXYZ” where W = pH, X = sonication time, Y = VR, and Z = [UMN]o. The positions are followed by a number (i.e., 1, 2, or 3), which corresponds to the level of the factor (i.e., low, medium, high conditions). Values are based on a 3-point percentile range from 0th (blue) to 95th (red) percentile end points and a 60th (yellow) percentile midpoint. Numbers that are highlighted in yellow bold text are above the 60% threshold, corresponding to 2-fold and 4-fold increase in yield and efficiency, respectively. The batch specific yield and efficiency are in the right column, and the comparison to the 95% CI upper limit is on the right. Yields are in the top row and efficiency heat maps are in the bottom row. Statistical outliers are marked with black background and red text. All trials were conducted in triplicate, and the reported values are the mean of the three replicates. No error is reported in this figure, please see the SI, Table S3, for raw values and error.
