
Figure 3.
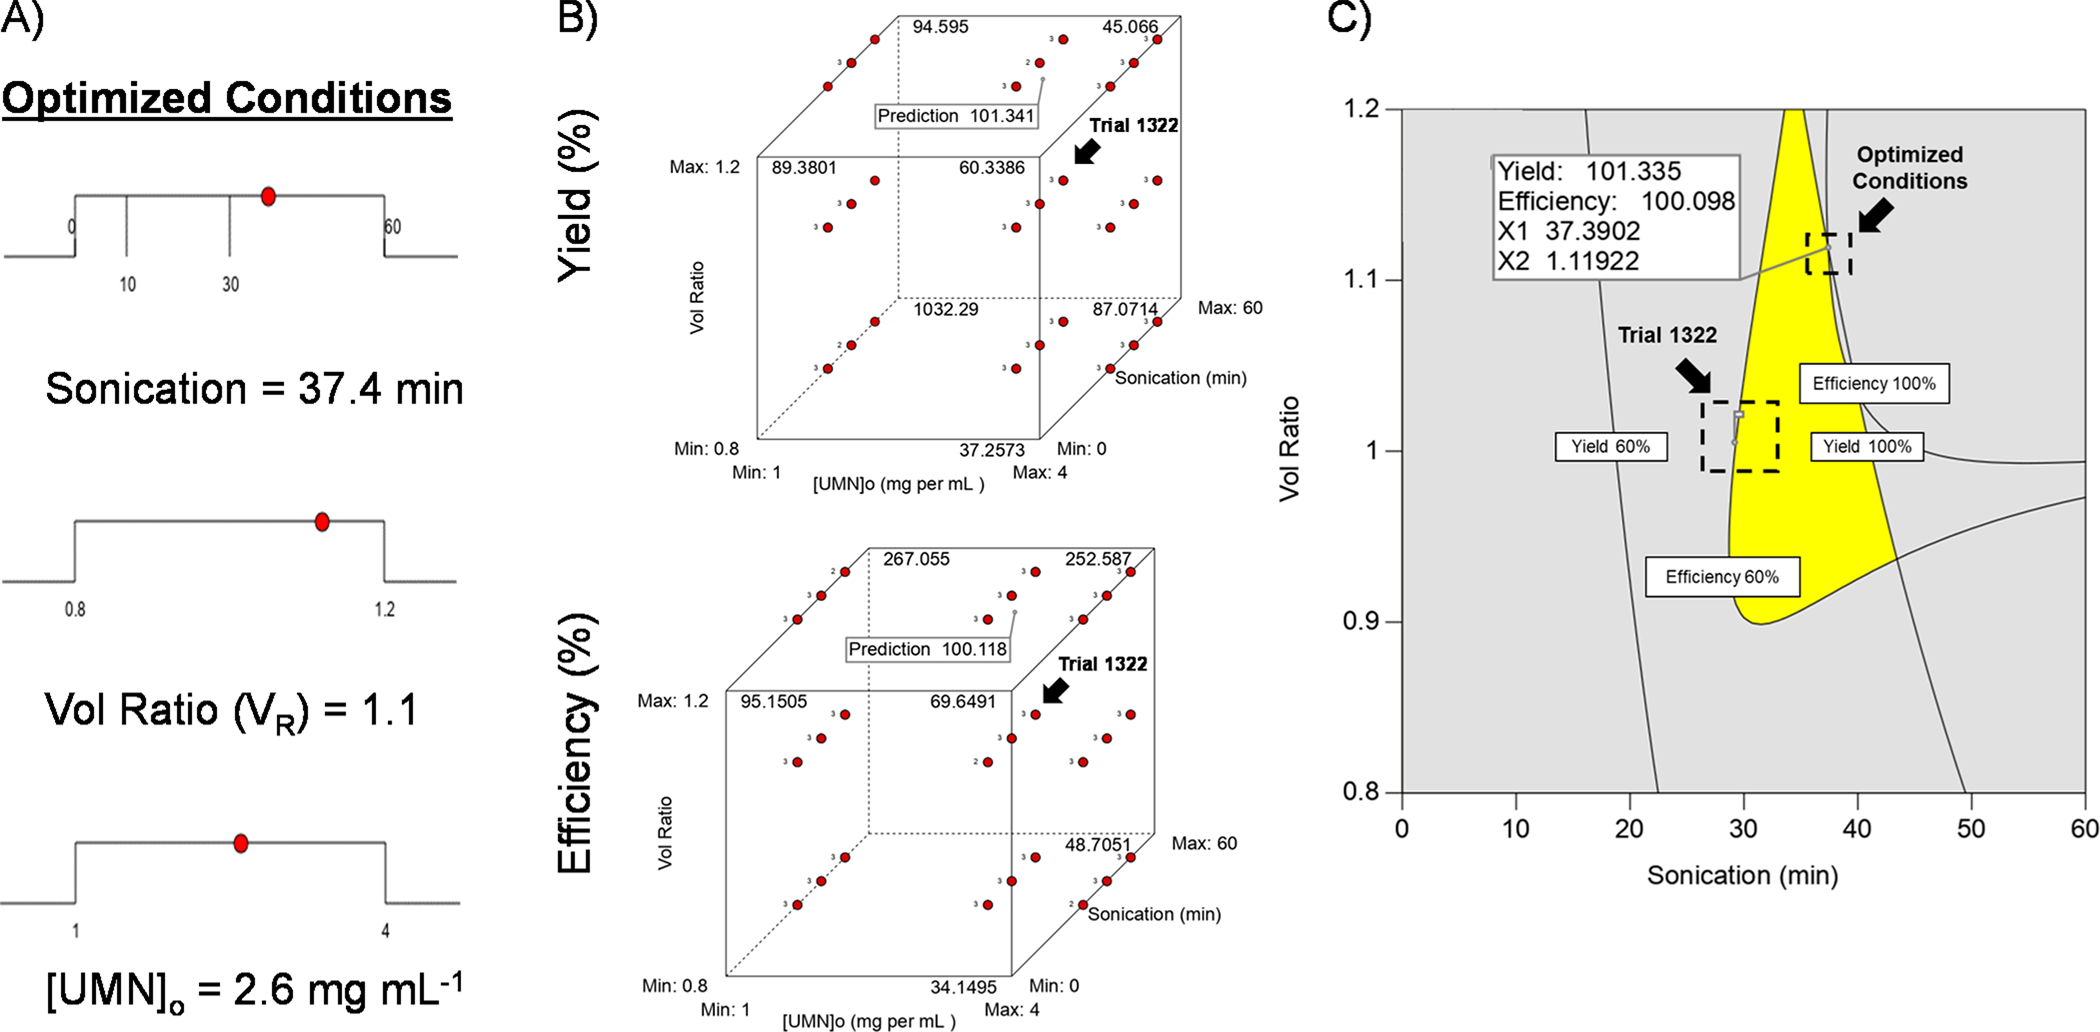
Optimized conditions for loading PFD PERFUMNs. (A) Ramp graphs showing optimization of factors: sonication (min), VR, and [UMN]o (mg mL−1). (B) Cube plots showing the effect of all three factors on yield (top) and efficiency (bottom). The values at the vertices represent predicted values; the prediction flag is the position of the optimal conditions; trial 1322 was pointed out for comparison to predicted optimization. (C) Overlay plot of optimization. The gray shaded areas are outside of the desired yield and efficiency boundaries. The yellow region is the optimal zone to get 60–100% yield and efficiency. Both the optimal and experimental trial (1322) are identified on the graph. The optimal conditions flag was manually selected, and the coordinates are not the exact parameters from the optimized fit (i.e., x-axis, y-axis).