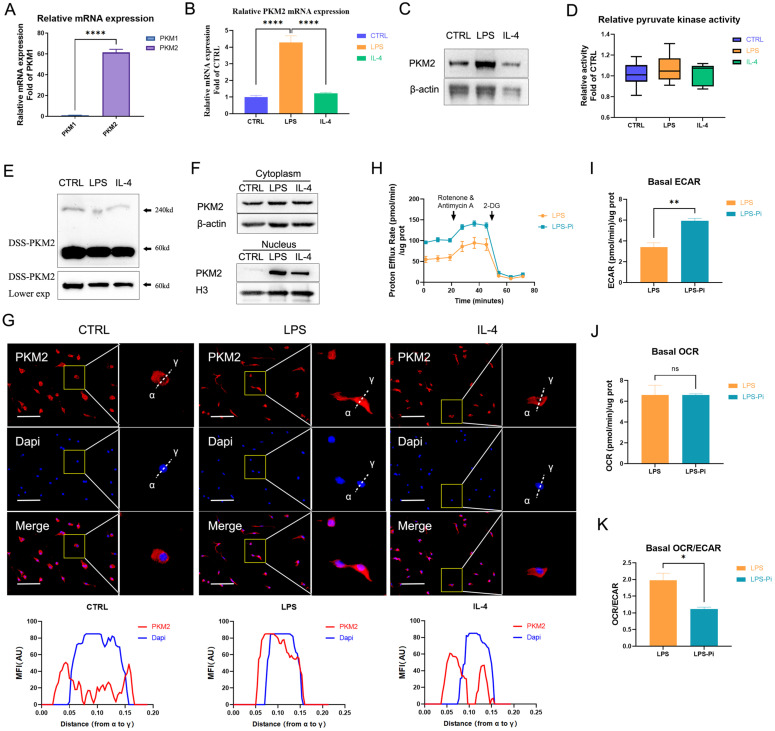
Figure 1.
PKM2 regulates glycolysis in lipopolysaccharide-induced macrophages. (A) The mRNA from naïve bone-marrow-derived macrophage (BMDM) cells was extracted to test PKM1 and PKM2 expression (n = 3). (B) Naïve BMDM cells (CTRL) were incubated with 100 ng/ml lipopolysaccharide (LPS) or 25 ng/ml IL-4 (IL-4) for 24 hr, then mRNA was extracted to test PKM2 expressions, which were normalized to the β-actin mRNA levels (n=3). (C) BMDM cell proteins were analyzed by western blotting (WB) for the PKM2 level. (D) BMDM cell lysates were assayed for pyruvate kinase activity (n=6). (E) BMDM cells were collected and crosslinked with disuccinimidyl suberate (DSS). The tetrameric (240KD), dimeric (120KD), and monomeric (60KD) forms of PKM2 were analyzed by WB. (F) Cytosolic and nuclear proteins were purified from the BMDM cells separately for PKM2 level analysis. (G) The localization of PKM2 was analyzed by immunofluorescence staining. The nuclei were stained with 4',6-diamidino-2-phenylindole (DAPI; blue). The line charts represent fluorescence intensity (MFI), presenting the distance from α to γ. (H) Naïve BMDMs were incubated with 100ng/ml LPS (4 hr), followed by ±1.2 µM PKM2 enzymatic inhibitor (Pi) for 20 hr. Proton efflux rate (PER; reflecting glycolytic rate) in BMDM cells is shown. Basal extracellular acidification rates (ECAR; I), basal oxygen-consumption rate (OCR; J), and basal OCR/ECAR (K) in BMDM cells treated with LPS ± Pi are shown. Data represents mean ± SEM, scale bar = 100 µm. *p < 0.5, ** p < 0.01, **** p < 0.0001.

