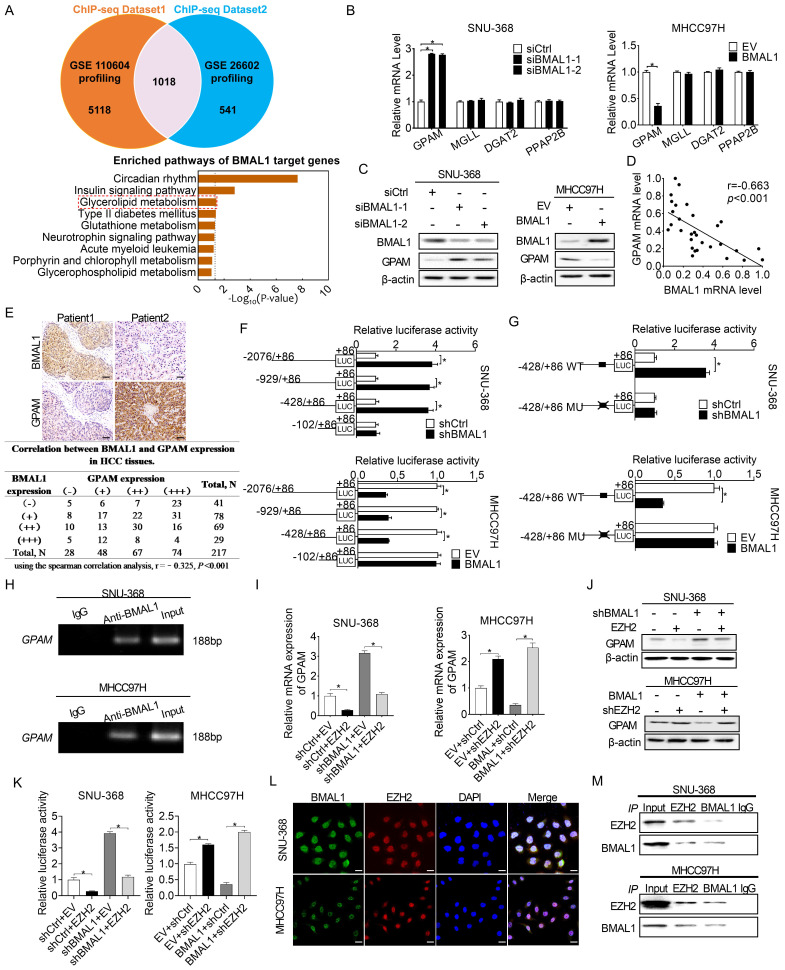
Figure 4.
BMAL1 transcriptionally repressed GPAM expressions in HCC cells in an EZH2-dependent manner. (A) Potential transcriptional targets of BMAL1 in two BMAL1 chromatin immunoprecipitation (ChIP) sequencing datasets were analyzed. (B and C) qRT-PCR and Western blot assays for GPAM, MGLL, DGAT2 and PPAP2B expressions in SNU-368 as well as MHCC97H cells after specific treatments. (D) Scatter plot assessment of the relationship between mRNA expressions of BMAL1 and GPAM in tumor tissues from 30 HCC patients. (E) Representative immunohistochemical (IHC) staining results (upper panel) and the relationship between protein expressions (lower panel) of BMAL1 and GPAM in tumor tissues from in 217 HCC patients. Scale bar, 100 µm. (F and G) Relative luciferase activities of the GPAM promoter were determined in SNU-368 and MHCC97H cells after treatments as indicated. (H) Amplification of GPAM promoter sequence in ChIP DNA from SNU-368 and MHCC97H cells. Input and IgG were the positive and negative controls, respectively. (I and J) mRNA and protein levels of GPAM in SNU-368 and MHCC97H cells after specific treatments. (K) Relative luciferase activities of GPAM promoter in SNU-368 and MHCC97H cells after specific treatments. (L) Representative immunofluorescent images of BMAL1 and EZH2 in SNU-368 and MHCC97H cells. Scale bar, 25 µm. (M) Immunoprecipitation of BMAL1 and GPAM in SNU-368 and MHCC97H cells after specific treatments. *p <0.05.

