Figure 5.
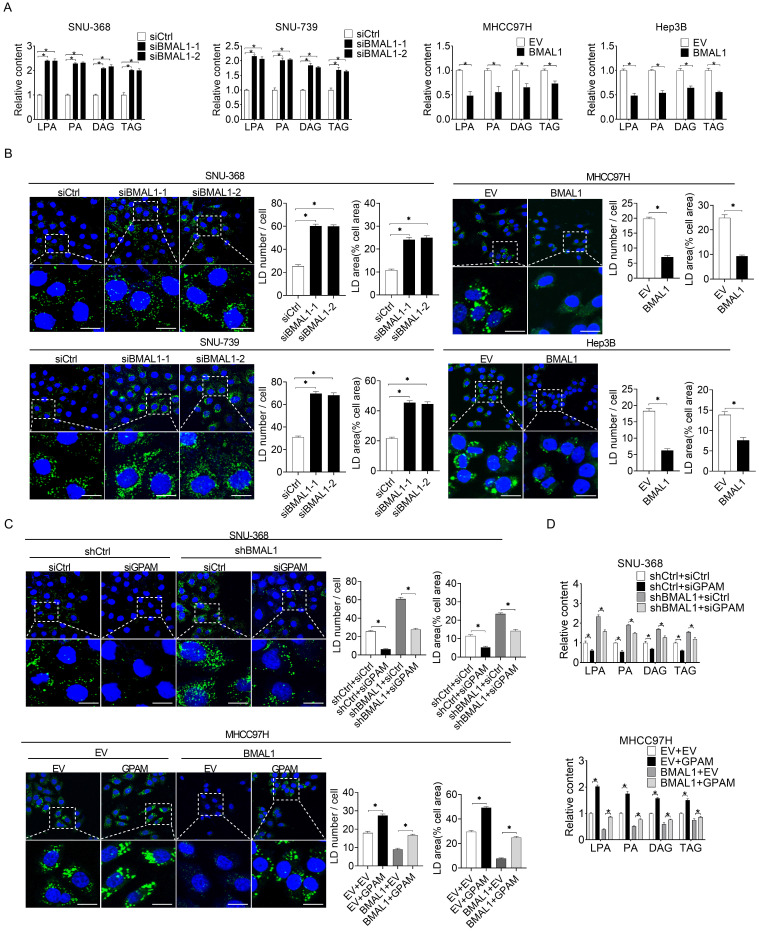
BMAL1 suppressed glycerolipid synthesis in HCC by inhibiting GPAM levels. (A) LPA, PA, DAG and TAG levels in treated SNU-368, SNU-739, MHCC97H and Hep-3B cells were evaluated by ELISA. (B) BODIPY 493/503 fluorescence dye staining for neutral lipids content in treated HCC cells. Scale bar, 25 µm. Average LD numbers per cell and proportion of cellular area occupied by LDs are quantified. (C) BODIPY 493/503 fluorescence dye staining for neutral lipid levels in treated HCC cells. Scale bars, 25 µm. Average LD numbers per cell and proportion of cellular area occupied by LDs are quantified. (D) LPA, PA, DAG and TAG in treated HCC cells were detected by ELISA. *p <0.05.

