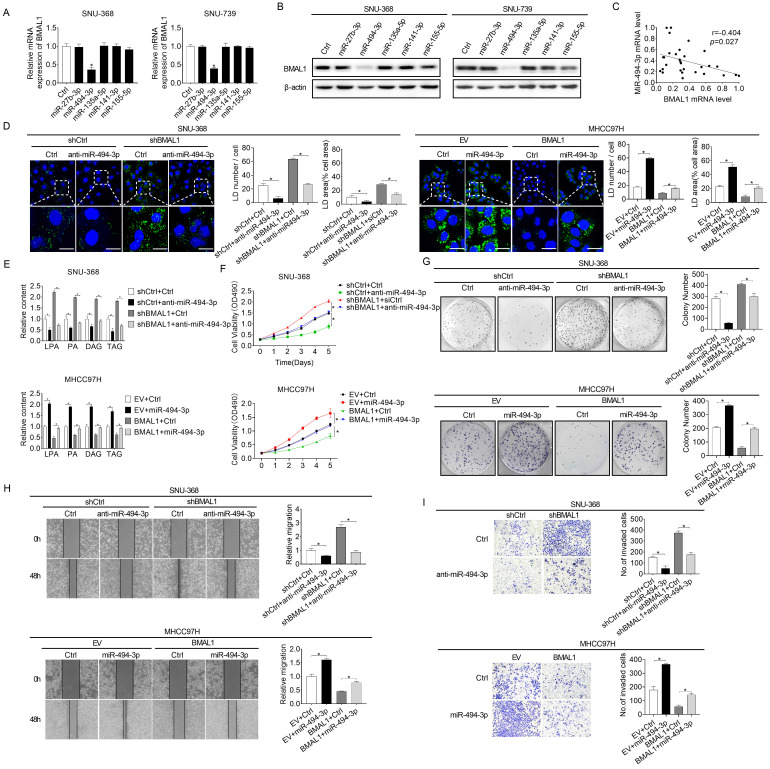
Figure 7.
Elevated miRNA-494-3p levels down-regulated BMAL1 in HCC cells. (A and B) qRT-PCR and Western blot analyses of BMAL1 expressions in specifically treated HCC cells. (C) Relationship between mRNA expressions of miR-494-3p and BMAL1 in tumor tissues from 30 paired HCC individuals. (D) Neutral lipid levels in specifically treated SNU-368 and MHCC97H cells were assayed by BODIPY 493/503 dye staining. Scale bars, 25 µm. Average LD numbers per cell and proportion of cellular area occupied by LDs were quantified. (E) LPA, PA, DAG and TAG levels in specifically treated SNU-368 and MHCC97H cells were determined by ELISA. (F and G) MTS and colony formation assays for specifically treated SNU-368 and MHCC97H cells. (H and I) Scratch-wound-healing and matrigel invasion assays for specifically treated SNU-368 and MHCC97H cells. *p<0.05.

