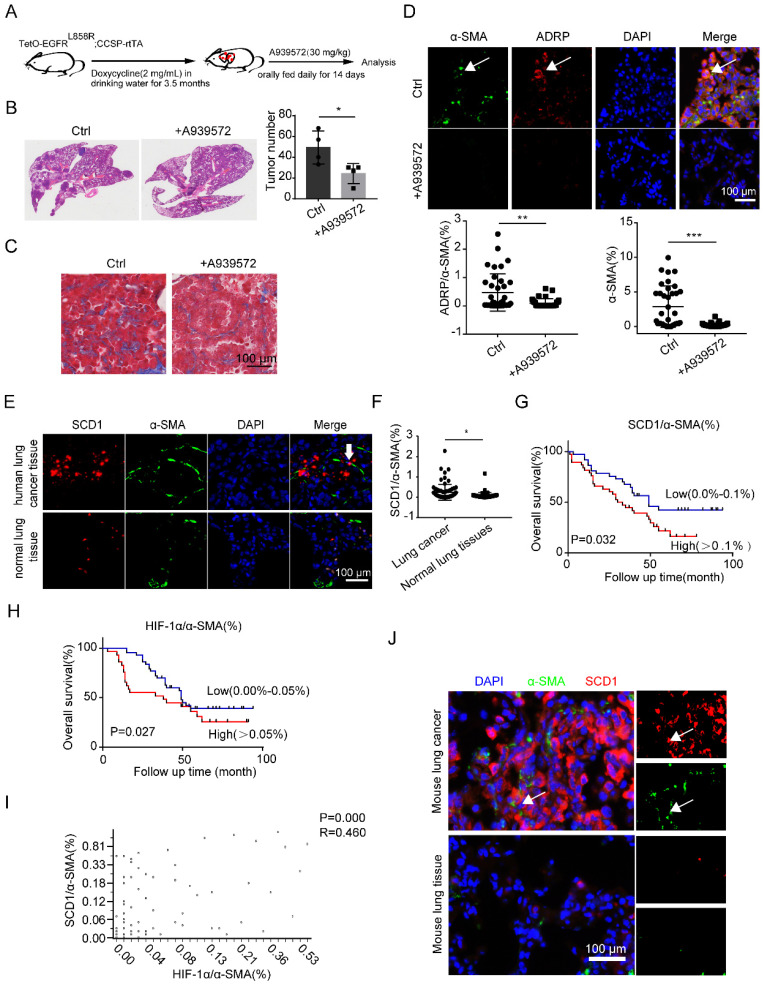
Figure 6.
SCD1 blockage inhibits lung cancer progression in vivo. (A) The procedure of doxycycline-induced mouse lung cancer model (TetO-EGFRL858R; CCSP-rtTA) treated with A939572 (SCD1 inhibitor: 30 mg/kg) daily for 14 days (N = 4 mice/group). (B and C) The H&E and Masson staining of doxycycline-induced mouse lung cancer tissues (TetO-EGFRL858R; CCSP-rtTA) that were administrated with or without A939572. (D) Representative immunofluorescence images of ADRP (red) co-stained with α-SMA (green) in frozen sections of mouse lung cancer tissues (Scale bar: 100 µm). (E) Representative immunofluorescence images of SCD1 (red) and α-SMA (green) in the lung adenocarcinoma tissue microarray (Scale bar: 100 µm). (F) The statistical analysis of SCD1/α-SMA% expression in lung cancer tissues and normal lung tissues from lung adenocarcinoma tissue microarray data (n = 75). (G) Kaplan-Meier overall survival curves for lung adenocarcinoma patients with low (blue line) or high (red line) expression of SCD1 in fibroblasts (co-staining of SCD1 and α-SMA). “Low” indicates that the percentage of co-staining of SCD1 and α-SMA cells is 0.0%-0.1% and “high” indicates the percentage of co-staining of SCD1 and α-SMA cells is > 0.1%. (H) Kaplan-Meier overall survival curves for lung adenocarcinoma patients with low (blue line) or high (red line) expression of HIF-1α in fibroblasts (co-staining of HIF-1α and α-SMA). “Low” indicates that the percentage of co-staining of HIF-1α and α-SMA cells is 0.0%-0.05% and “high” indicates that the percentage of co-staining of SCD1 and α-SMA cells is > 0.05%. (I) Correlation between co-staining of SCD1 and α-SMA and co-staining of HIF-1α and α-SMA in lung adenocarcinoma paraffin section samples from lung adenocarcinoma tissue microarray (Pearson's correlation test, n = 68, r = 0.460, p = 0.000). (J) Representative immunofluorescence images of SCD1 (red) co-stained with α-SMA (green) in frozen sections of mouse lung cancer tissue and normal lung tissue (Scale bar: 100 µm). Data are shown as the Mean±SD; *p < 0.05; **p < 0.01; ***p < 0.001.

