Fig. 1.
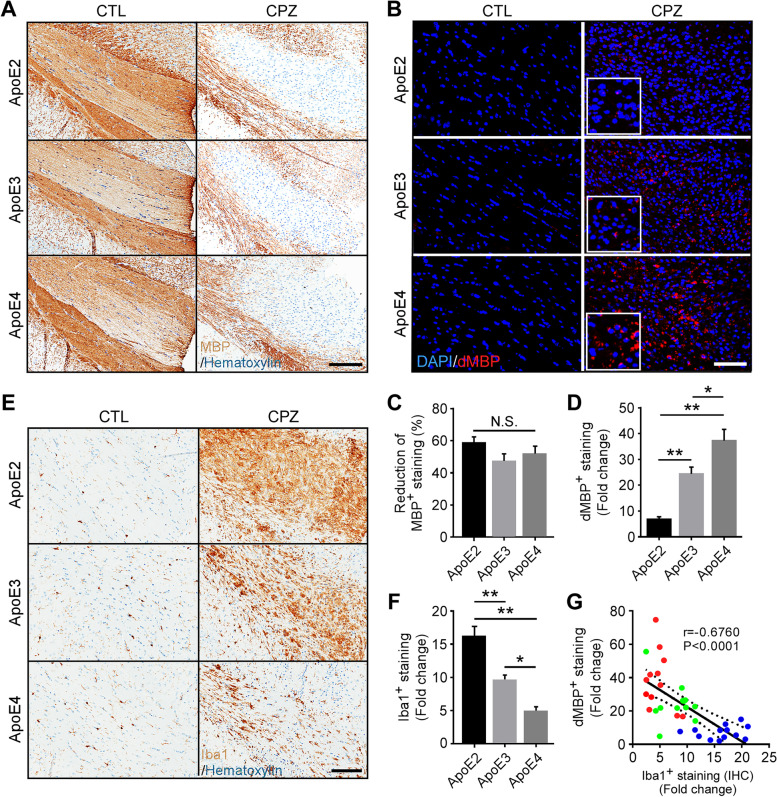
Opposing effects of apoE2 and apoE4 on microglia-mediated clearance of myelin debris in the corpus callosum of apoE-TR mice upon cuprizone-induced demyelination. ApoE-TR mice were fed with either normal diet (CTL group, n = 5/genotype), or cuprizone-containing diet (CPZ group, n = 12–13/genotype) for 4 weeks. A Myelin integrity in the corpus callosum (CC) of experimental mice was evaluated by immunostaining using an antibody specific to intact myelin basic protein (MBP). Representative images of the CC region are shown. Scale bar, 100 µm. B Myelin accumulation in the form of myelin debris was examined by immunostaining using an antibody specific to degraded myelin basic protein (dMBP). Representative images for dMBP staining are shown. Red, dMBP; Blue, DAPI. Scale bar, 50 µm. C The percentage (%) reduction (CPZ vs. CTL) of immunoreactivity of MBP (% Area) in the CC region was quantified. In D, F, G, the fold change represents the immunoreactivity of CPZ-treated mice compared to their respective control corresponding to their apoE genotype. D The immunoreactivity of dMBP (% Area) in the CC region was examined by immunofluorescence (IF) staining and the fold change (CPZ vs. CTL) was quantified. E, F The microglia in the CC of control and CPZ-treated apoE-TR mice were examined by immunohistochemistry (IHC) for Iba1. Representative images of Iba1 immunoreactivity are shown. Scale bar, 100 µm. The fold change (CPZ vs. CTL) of Iba1+ staining (%Area) was quantified. G A negative correlation was found between the fold change of Iba1+ microglia (IHC) and the fold change of dMBP+ myelin debris upon CPZ treatment. The Pearson correlation coefficient (r) and P values are shown. Blue dots, apoE2; Green dots, apoE3; Red dots, apoE4. Values are mean ± Standard error of the mean (SEM). One-way ANOVA. *P < 0.05; **P < 0.01. N.S., no significant

