Fig. 3.
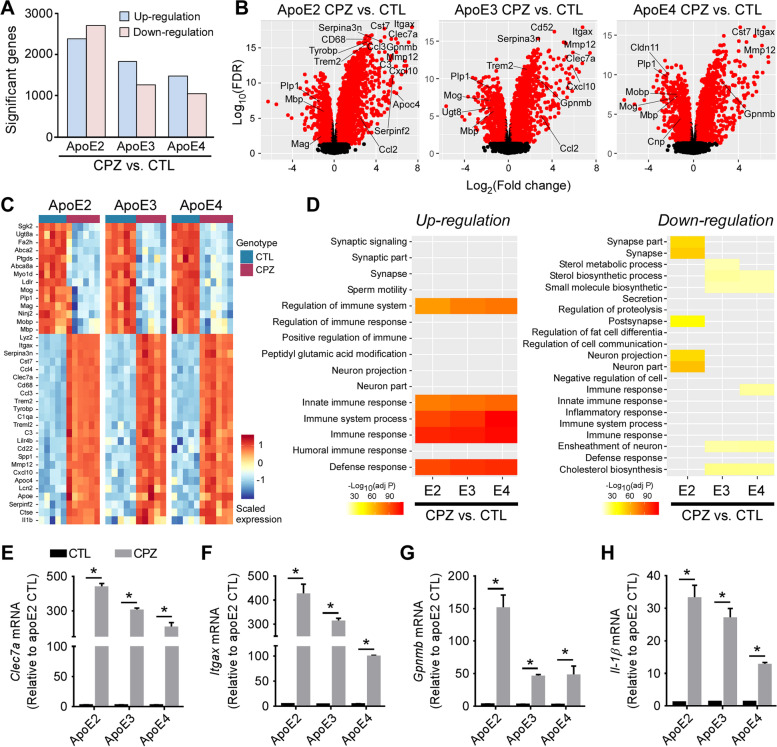
The transcriptomic profiles of apoE-TR mice upon cuprizone-induced demyelination. RNA extracted from the CC area of control (n = 5/genotype) and CPZ-treated (n = 5–6/genotype) apoE-TR mice was subjected to transcriptomic profiling. A An overview of up-regulated and down-regulated gene changes in apoE-TR mice upon CPZ treatment. B Volcano plot representation of differentially expressed genes (DEGs, CPZ vs. CTL for each apoE isoform). Genes significant at the FDR adjusted P value ≤ 0.05 and fold change ≥ 1.2 are denoted red in color. The X-axis represents log2 transformed fold-change (CPZ vs. CTL) and y-axis represents the -log10 adjusted P value. C Heat map representing transcriptional expression of selected genes in the CPZ and CTL groups. The scaled expression value (row Z score) is shown with a blue-red color scheme, denoting red as higher expression and blue as lower expression. D The up-regulated and down-regulated pathways in apoE-TR mice upon CPZ treatment compared to control animals. E–H The expression of immune response-associated genes (e.g., Clec7a, Itgax, Gpnmb, and Il-1β) was validated by real-time PCR. Values are mean ± SEM. Mann–Whitney tests followed by Bonferroni correction for multiple comparisons were used. *P < 0.0167

