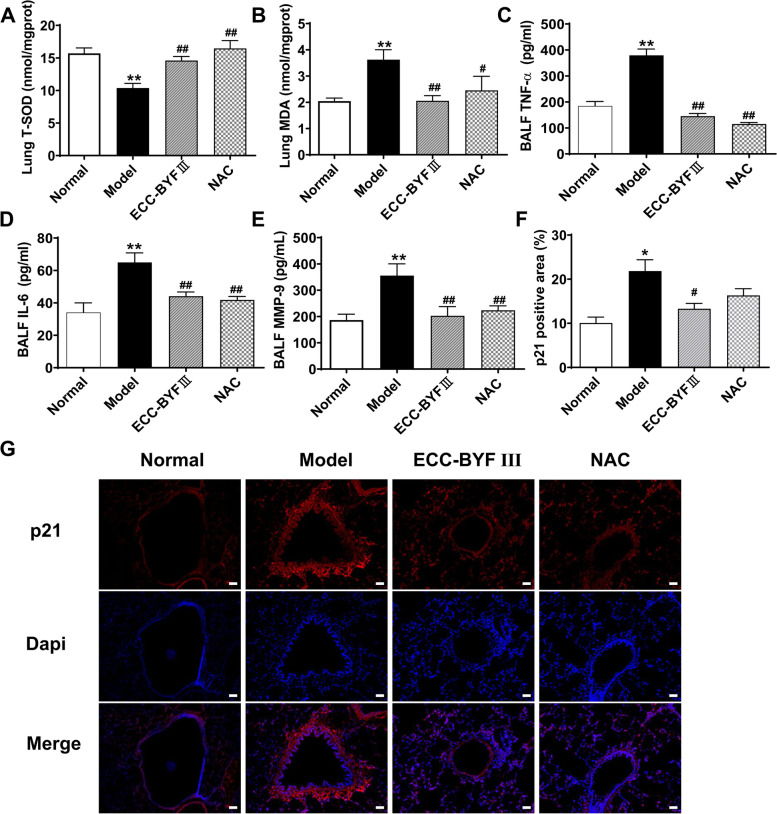
Fig. 3.
Effect of ECC-BYF III on cell senescence-associated secretory phenotype in COPD rats. A, B The expression of T-SOD and MDA in lung tissue; C, D The expression of inflammation cytokines in BALF; E The expression of MMP-9 in BALF; F The expression of p21 positive area (%). The data are expressed as the mean ± SE, (n = 6). Animals are randomly selected. **P < 0.01 vs. the normal group, *P < 0.05 vs. the normal group; ##P < 0.01 vs. the model group, #P < 0.05 vs. the model group; G immunofluorescent staining of p21, and red-stained represents the expression of p21, (magnification, × 200). Bar: 50 μm

