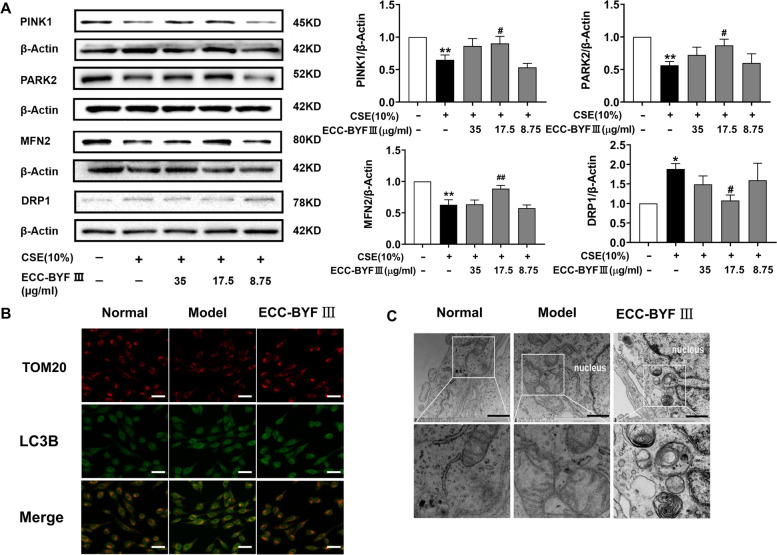
Fig. 5.
ECC-BYF III regulated CSE-induced mitophagy deficiency. A PINK1, PARK2, MFN2 and DRP1 levels as assessed by western blot; Full-length gels are presented in Supplementary Fig. 2; The data are expressed as the mean ± SE, (n = 4). **P < 0.01 vs. the normal group, *P < 0.05 vs. the normal group; ##P < 0.01 vs. the model group, #P < 0.05 vs. the model group; B Immunofluorescent staining of the co-localization of TOM20 (yellow dots) and LC3B (green dots), (magnification, × 200); Bar: 50 μm. C Electron microscopy detection of mitochondria and mitophagy in BEAS-2Bs (magnification, × 30,000). Bar: 1 μm

