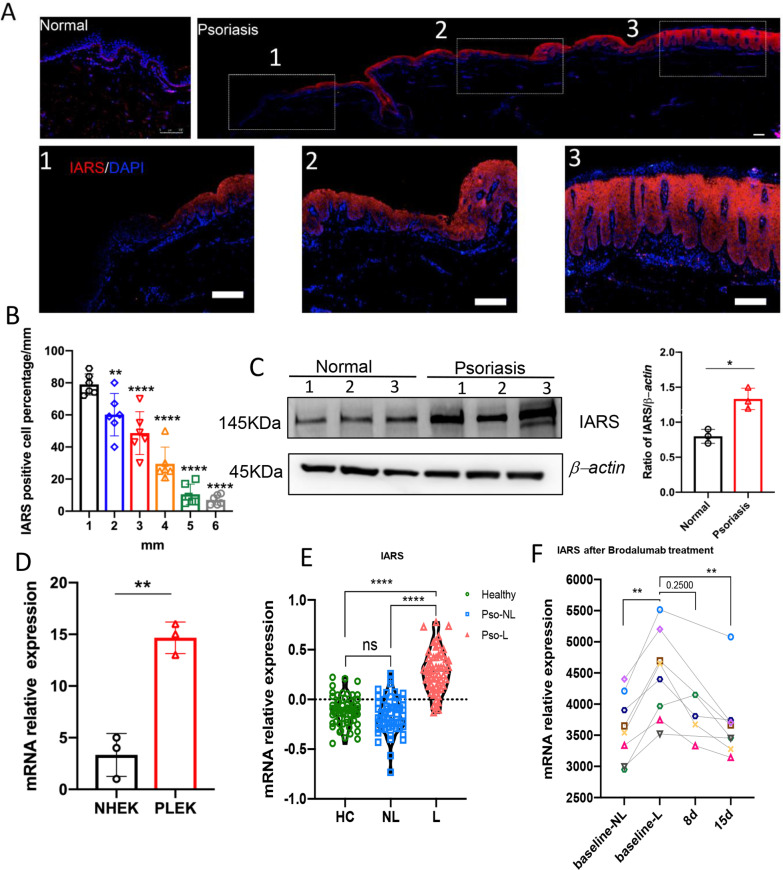
Fig. 1.
Expression profile of IARS in human normal skin, psoriasis patient skin, NHEKs and PLEKs. A Representative immunofluorescence images of IARS in the skin of normal person (left) and psoriatic patient (right). Scale bar = 100 μm. The 1-2-3 of the dashed boxes represent the enlarged non-lesional skin, peri-lesional skin and lesional skin respectively. B Quantification analysis of immunofluorescence staining of IARS positive cell percentage for psoriasis patient of different distance (n = 6 ± SEM), **P < 0.01 versus 1 mm, ****P < 0.0001 versus 1 mm. C The western blot analysis was performed to measure the expression of IARS from normal and psoriatic epidermis (n = 3 ± SEM) *P < 0.05. D Relative mRNA expression levels in NHEKs and PLEKs were determined by qRT-PCR: IARS (n = 3 ± SEM) **P < 0.01. E Microarray detected the relative expression of IARS in human psoriatic lesional skin (L, n = 58), non-lesional skin (NL, n = 58) and healthy controls (HC, n = 64). Mann Whitney test was used in this analysis (****P < 0.0001 vs. lesional). F The expression of IARS in the skin of psoriasis patients were detected by Affymetrix Human Genome U133 Plus 2.0 Array, before and 8 days/15 days after anti-IL-17RA (brodalumab, 350 mg) treatment. Each color dot represents individual patient (n = 8), and Wilcoxon matched-pairs signed rank test was used in this analysis (**P < 0.01 vs. baseline-lesional)

